Verity VM Installation (VMware 7.0.3)🔗
Introduction🔗
The Verity system is comprised of three functional components, all of which are instantiated as Virtual Machines (VMs). This document describes the installation and configuration of these VMs within a VMWare ESXi server.
Prerequisites🔗
Resource Calculator🔗
Use the VM Resource Calculator to determine system resources.
Virtual Machine Overview🔗
Verity’s three VM functional components:
| Virtual Machine | Function |
|---|---|
| Virtual Network Commander (vNetC) | Orchestration logic, GUI hosting, northbound RESTful API, and databases. |
| Software Defined LAN Controller (SDLC) | The SDLC VM is comprised of a series of containers that map one-to-one to the managed switch devices. Network discovery, device provisioning, and network assurance. The SDLC serves as the abstraction layer between the managed switch and the vNetC by translating the native management protocols into the vNetC’s NETCONF interface and Yang model. |
| Monitoring | The Monitoring VM is comprised of various containers that collect, process and display the network device details that are managed by Verity. |
Virtual Machine Topology🔗
Below is the basic VM and hardware topology for reference: 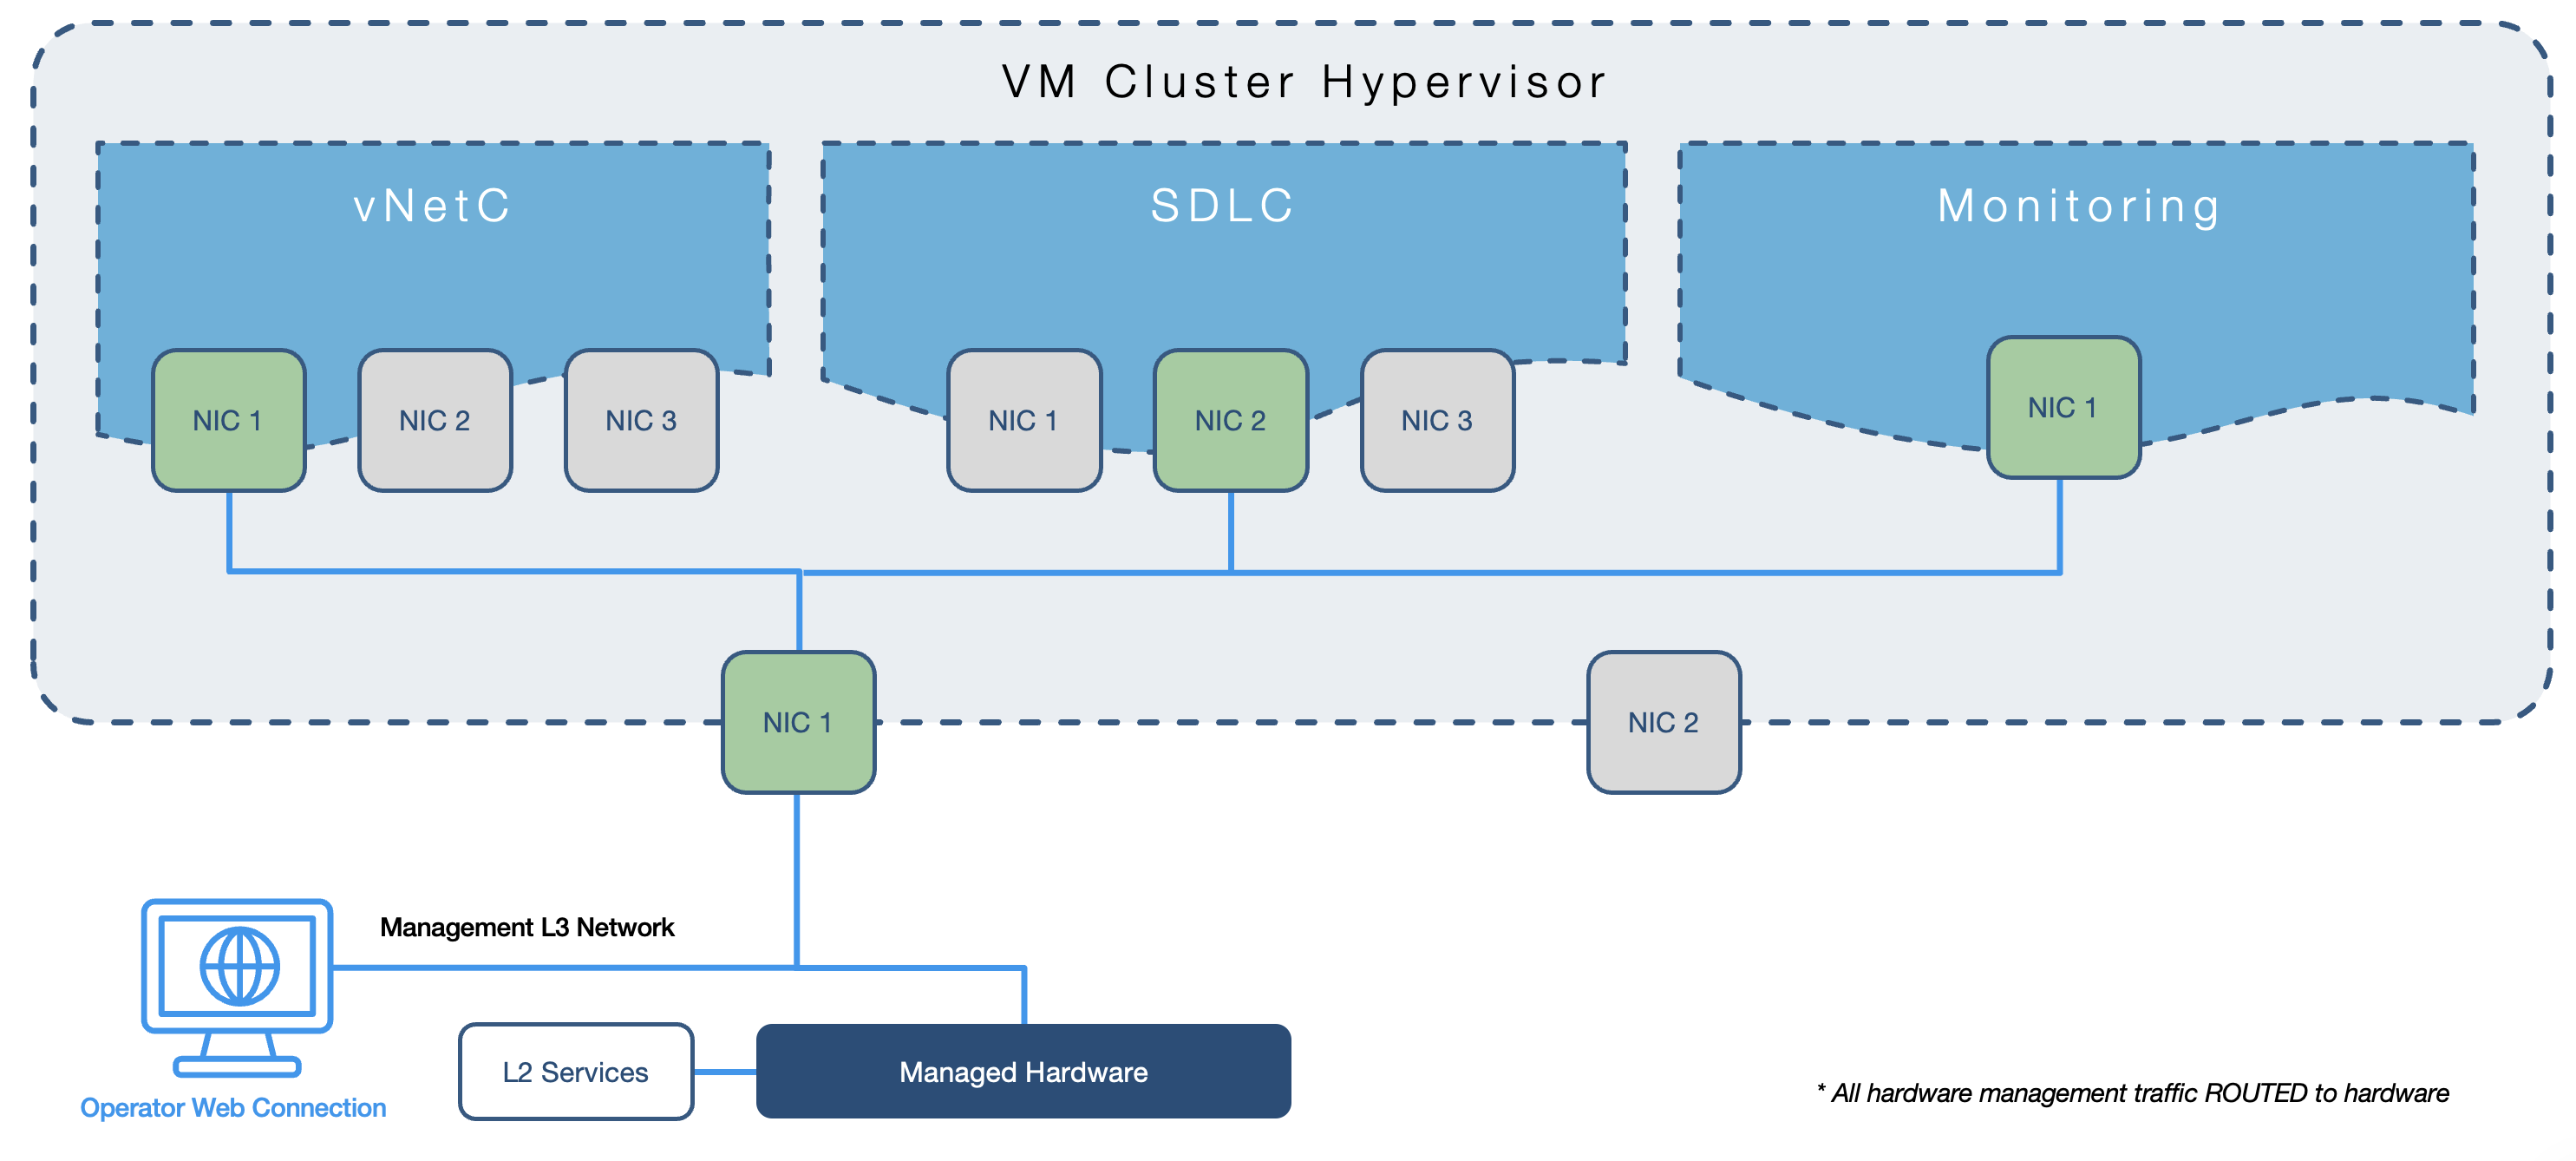
Public IP Addresses
The standard installation assumes private IP addresses are used by the Verity components and the managed switches. If that is not the case, refer to details in the section "Configure vNetC from the Console" below.
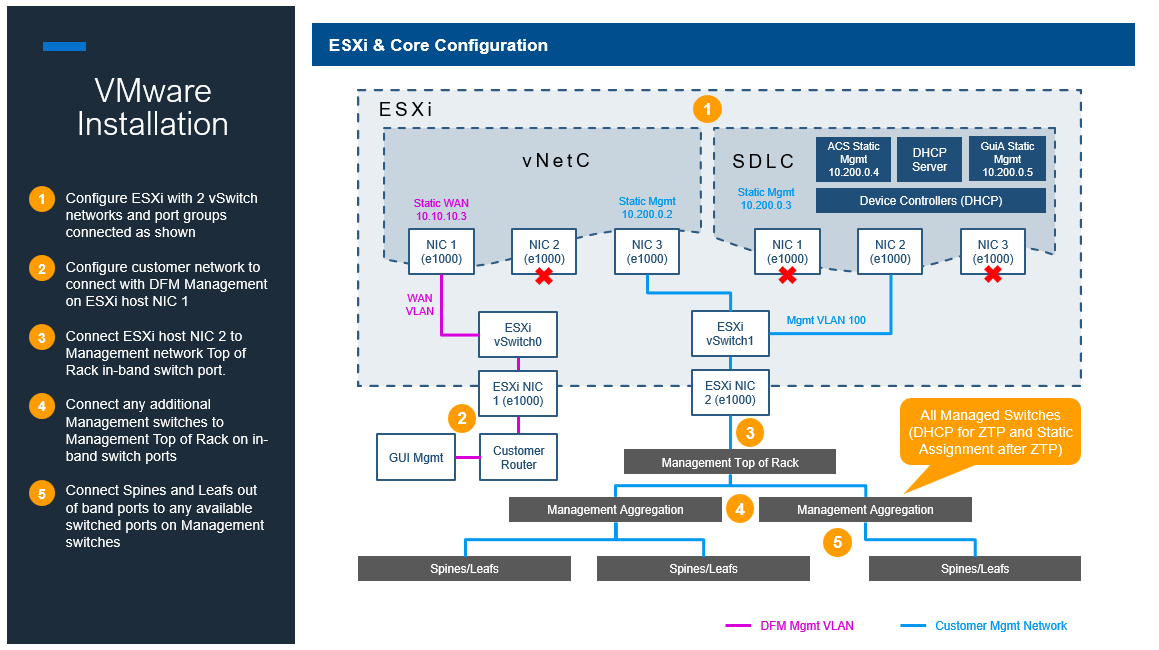
The following diagram shows the recommended management network architecture. Variations are possible based on individual customer’s network needs.
Install vNetC VM🔗
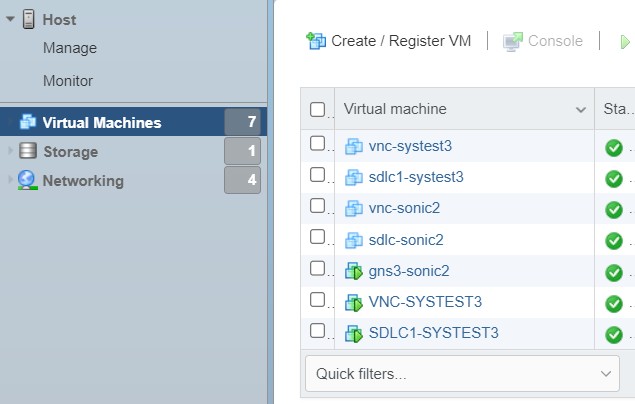
- Go to Virtual Machines.
- Click Create/Register VM.
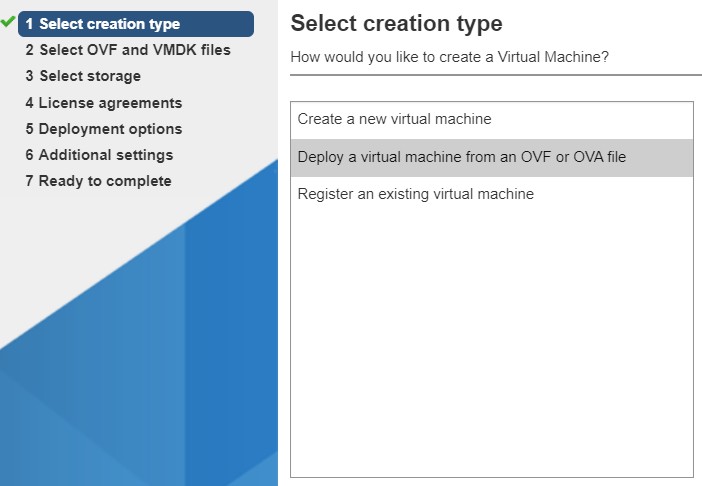
- In the window that appears select Deploy a virtual machine from an OVF or OVA file.
- Click Next.
- Enter a name for the VM and upload the vNetC VM Image OVA file via the prompt that says Click to Select file or drag/drop.
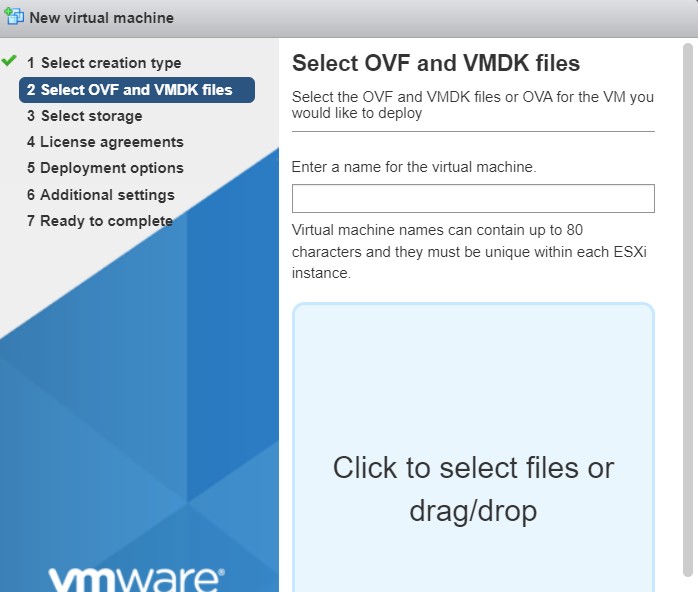
- Click Next.
- Select the desired data store options. Click Next.
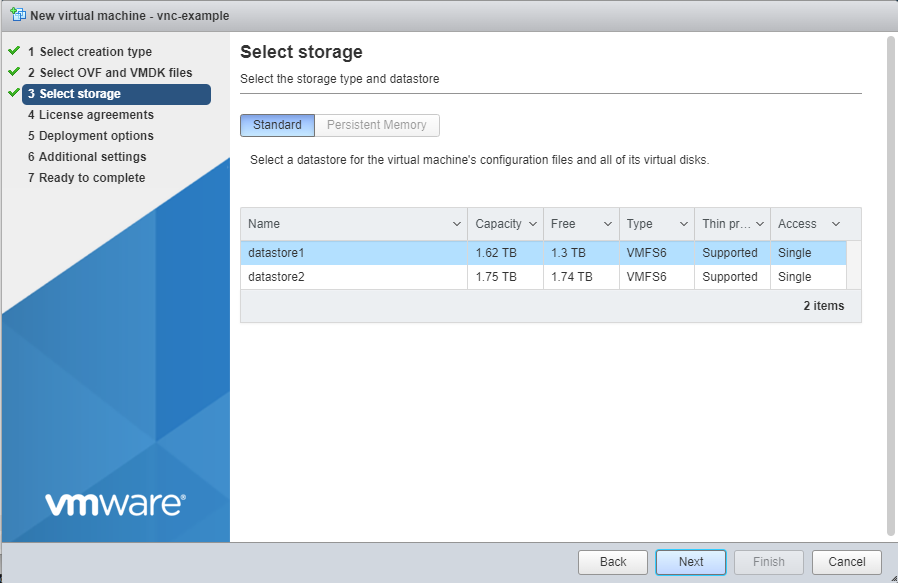
- Set the Deployment options and network mappings to the correct Port Group.
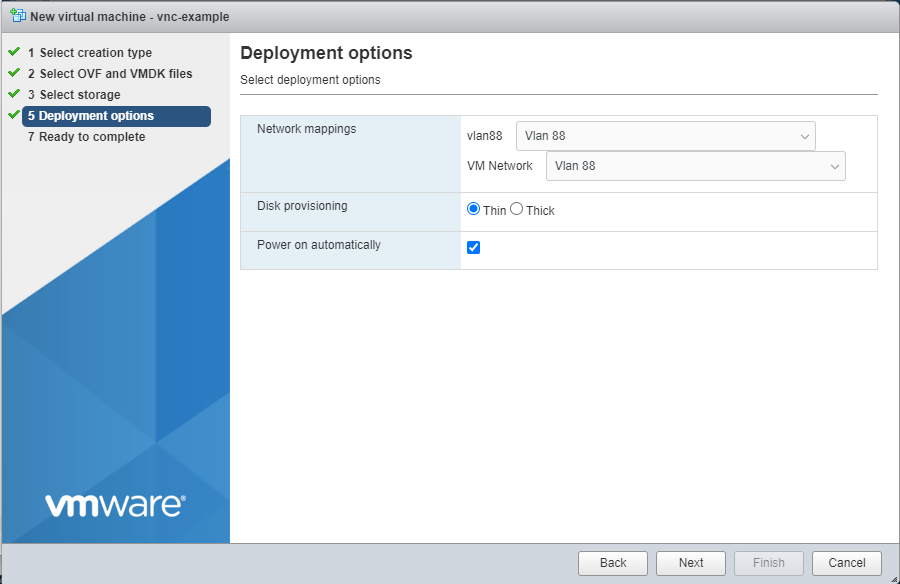 . This Port Group must be set to promiscuous mode.
 - Click Next.
- Review the settings and if they are correct, click Finish.
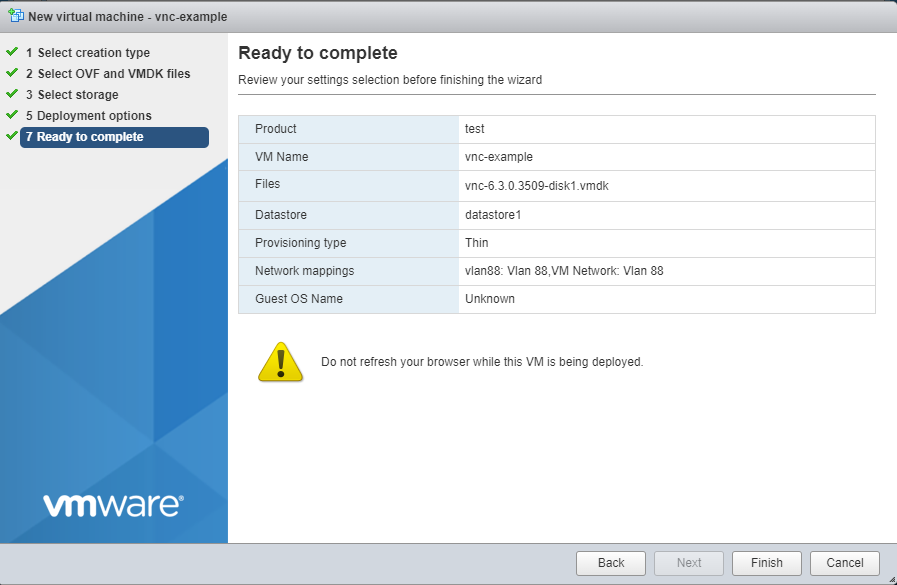
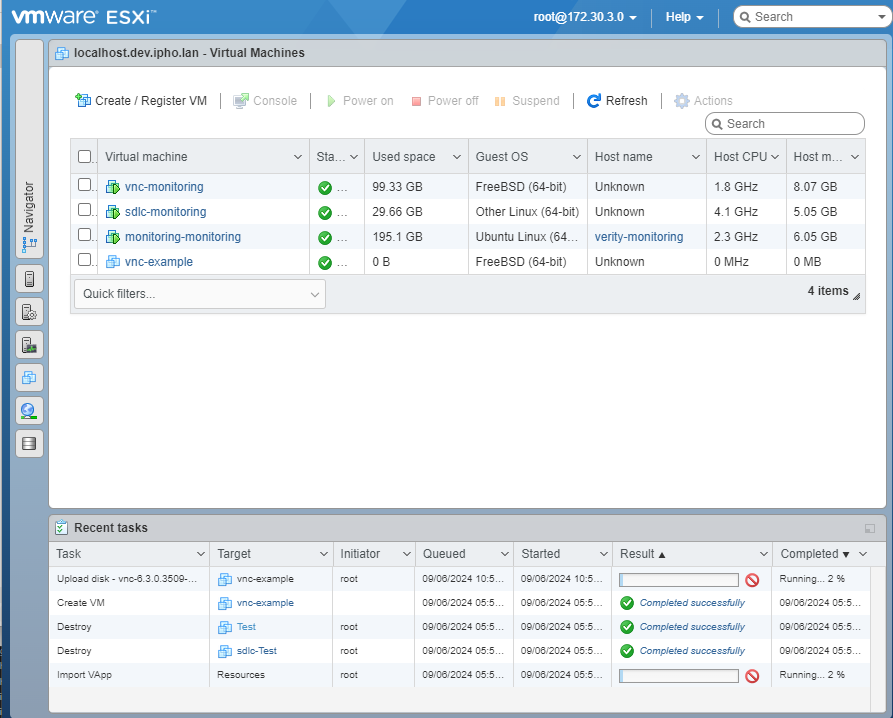
- The VM creation process will start. When the process completes the progress bar in Recent tasks at the bottom of the screen will say Completed Successfully.
Configure the vNetC from the Console🔗
This step requires you to configure the vNetC with an IP address and Fully Qualified Domain Name (FQDN). To do so, you need to open the VM console.
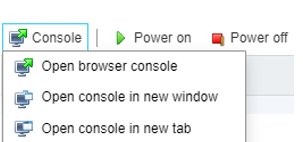
- Select your VM under the Virtual Machine column and click Console/Open browser console.
- The VM console appears. The vNetc initialization may take several minutes. While waiting you can press Enter and wait for login prompt.
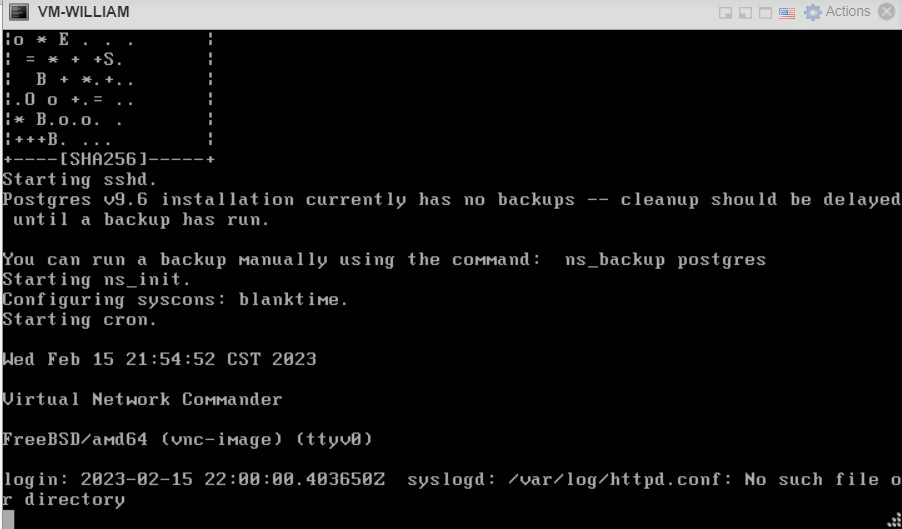
- Login to the vNetC with username root and password vnc1234.
- Enter a new password if prompted (new password = vnc1234). If not prompted for the password, you can continue to use the default password or change it with the passwd command.
- Run the administration application from the shell by typing ns_admin and pressing Enter.

- You are prompted to enter a web user interface admin account password (ex. admin). Document the password you choose as it will be required for GUI authentication later in the process. It is very important that you remember the password!
-
Press Enter when complete.
-
In the Admin Menu, select Network Configuration.
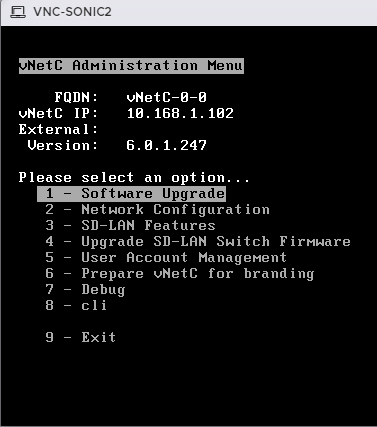
- Press Enter.
- Select FQDN (Fully Qualified Domain Name). Press Enter and set to the desired Fully Qualified Domain Name. If the field is prepopulated, it is required that you replace the default text with your own FQDN.
- Verify that WAN IP DHCP is disabled. If WAN IP DHCP is enabled, disable it using the menu.
- Select WAN Static IP Settings, press enter.
- Enter the following information:
- IPv4 Address and subnet in CIDR format (x.x.x.x/#)
- Default Route (Gateway)
- DNS Server 1 & DNS Server 2 (optional)
- Return to the network configuration menu.
- Save Settings.
- Follow the prompt and the VM will reboot with the new settings configured.
Public IP Addresses
The standard installation assumes private IP addresses are use by the Verity components and the managed switches. If that is not the case, refer to the instructions below.
- ssh back into the vNetC as the root user
-
copy the following string and paste into the command line
ns_vnc_setup --features acs_tunnel=1
Install the License (required) and Upgrade to the Latest vNetC Core Software🔗
Note
For file transfers to the system for vNETC and other components, users can scp directly to the system as opposed to using file drag-n-drop. Files should be transferred to /var/n/direct location. After successful transfer, the "deploy" button show on the screen as it does after using GUI to transfer files. License file can be directly transferred to the /var/ns/license directory.
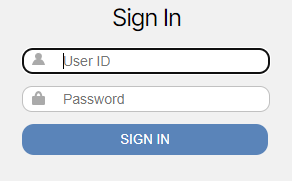
- Use Chrome Web Browser to access the vNetC IP address that was just configured.
- At the login prompt enter username admin and the administration password configured in the menu during installation. These are the credentials you entered in step 3 of Configure the vNetC from the Console.
- When the window appears, record the information on the Licensing tied to line. Provide this information to customer support to obtain your license file.
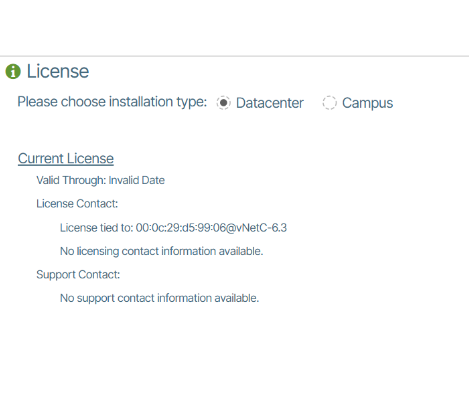
- After you obtain your license.cms file you are required to upload it to the application. In the License window select data center or campus (depending on your system). Use the drag and drop palette to upload the file or browse for the file. The license file may also be embedded in a \<filename>.tar file and this can also be directly imported and the system will extract the license.cms file.

- After you upload the file make sure a success message is presented.

- Click the button that says Yes to confirm the restart.
- After the landing page has fully completed populating select the Admin button (lower left).
- Select Software Packages tab (top of screen) and click vNetC Packages.
- Using the Browse Files (or drag and drop) field, import the vNetC Core Upgrade file provided by customer support.

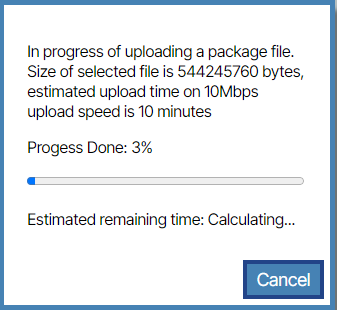
- When the process is complete you are presented with a success message.


- Click the Deploy button.
- When prompted to continue, click Yes. The software updates.
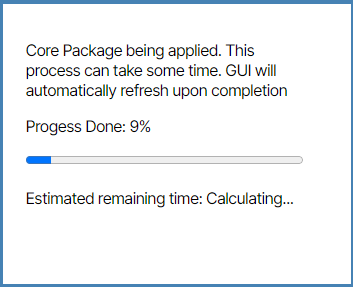
Temporary Error Message
You may see an error titled Fatal Error WebSocket Error: Connection lost -2 appear, this is normal. The browser may temporarily say that the site cannot be reached. When the process is done the landing page will render.
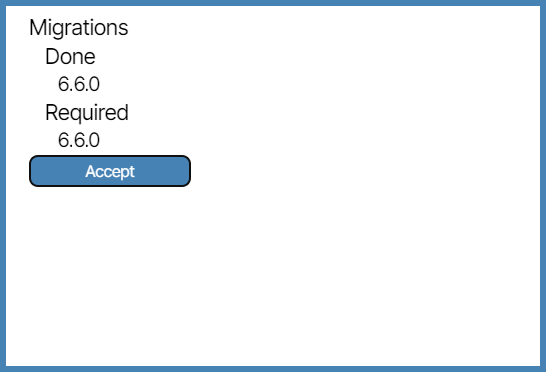
- If you see a migrations prompt click Accept.
 .
. - If you see a tan prompt that says Backend Services not attached, no Backend Service Switch, clear the message by clicking it.
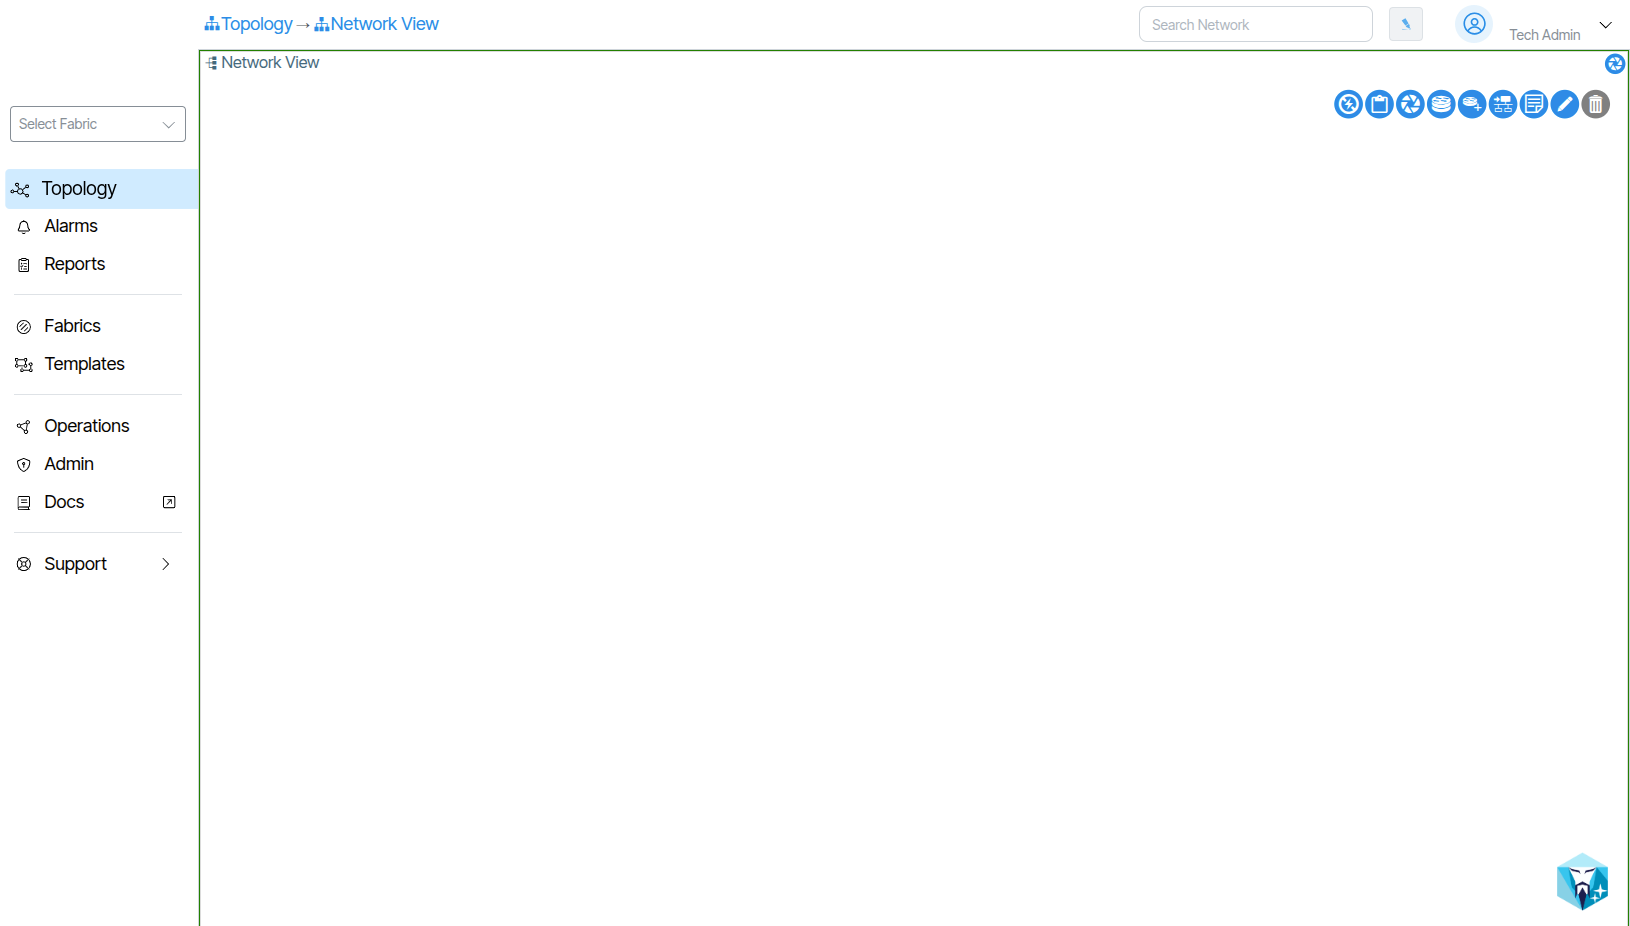
- The display should look like the following image:
- Go back to the VNC Console in VMware and type
poweroffin the CLI. This will cleanly shutdown the VNC.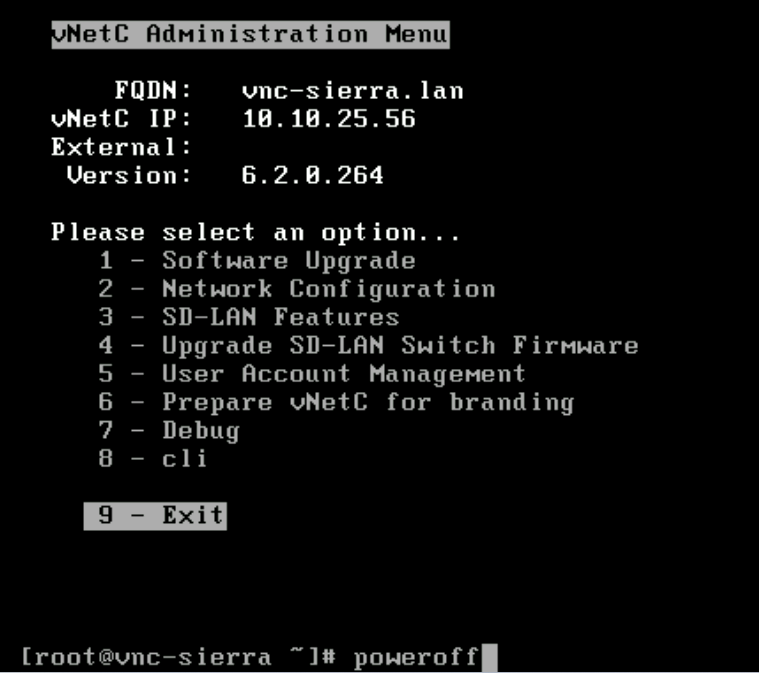
Congratulations
You have now successfully installed the VNetC VM.
Install SDLC VM🔗
SDLC NIC Mapping when using vCenter
When deploying the SDLC with vCenter, the NIC to MAC mapping can be remapped, causing connectivity issues with the SDLC and vNetC. If using vCenter to deploy the OVA, check the NIC Mapping on the SDLC by logging in to the SDLC's console, and going to Administration -> Network -> NIC-Map and enter show to see mapping: 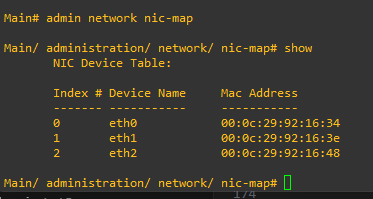 Verify that the MAC Address for the NIC's in the Mapping match with what the MAC Addresses in VMWare say:
 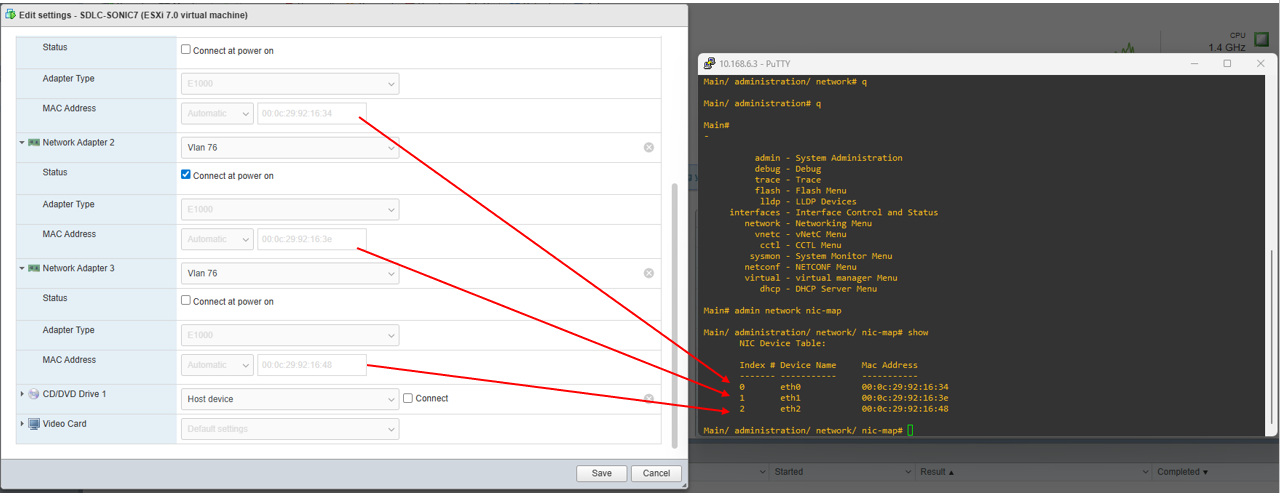 If changes are required, use the
 edit command and select the Index number and map it to the correct MAC Address.
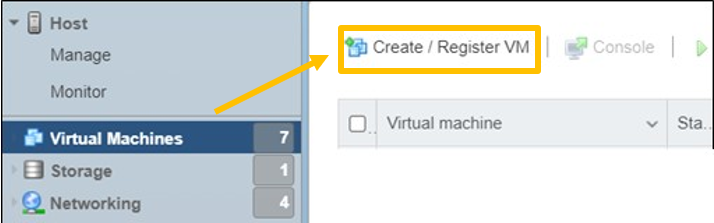
- Go to Virtual Machines. Click Create/Register VM.
- In the window that appears select Deploy a virtual machine from an OVF or OVA file.
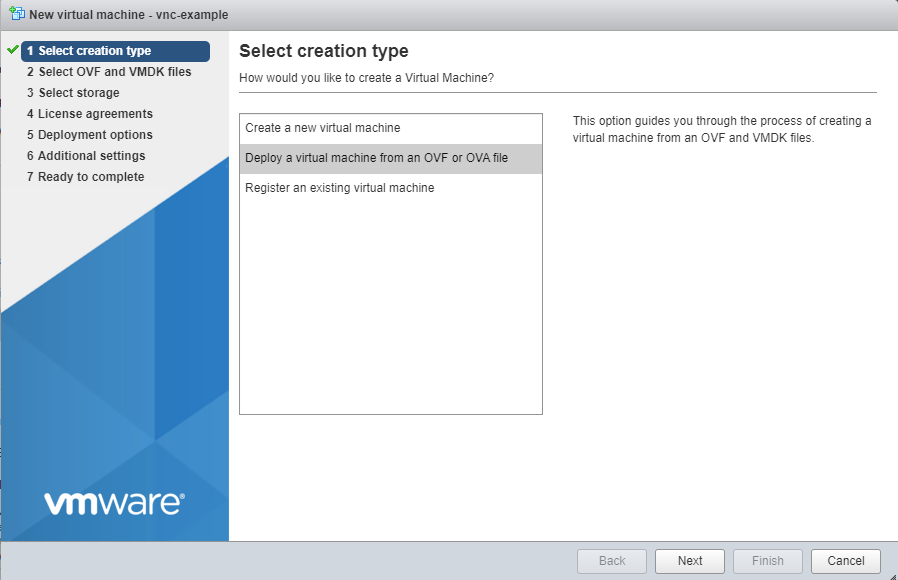
- Click Next.
- Enter a name for the VM and upload the SDLC VM Image OVA file via the prompt that says Click to Select file or drag/drop. Click Next.
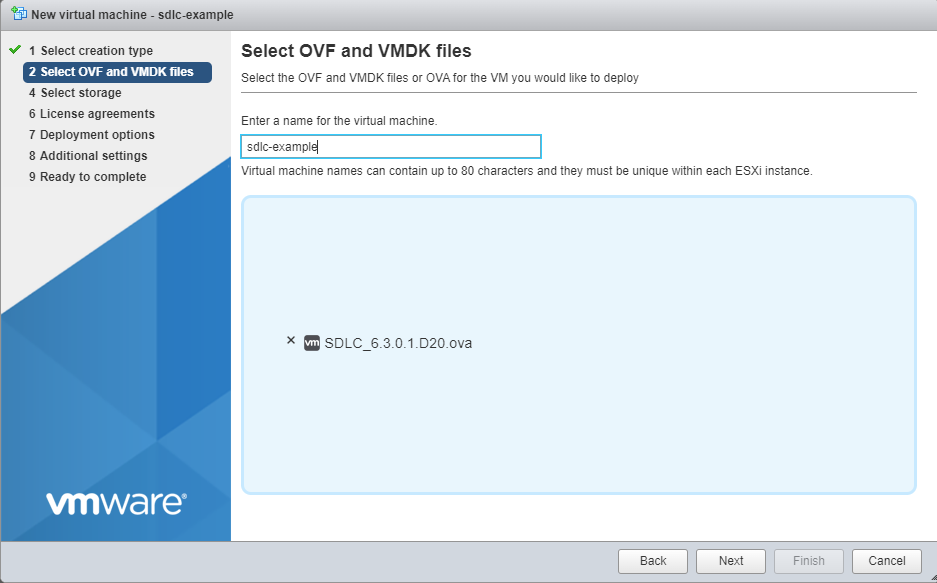
- Select the desired data store options. Click Next.
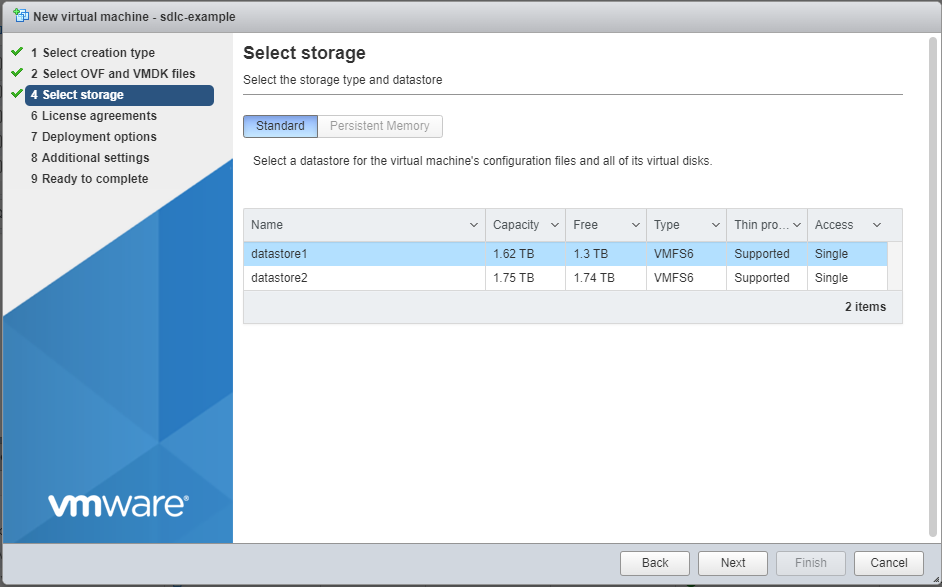
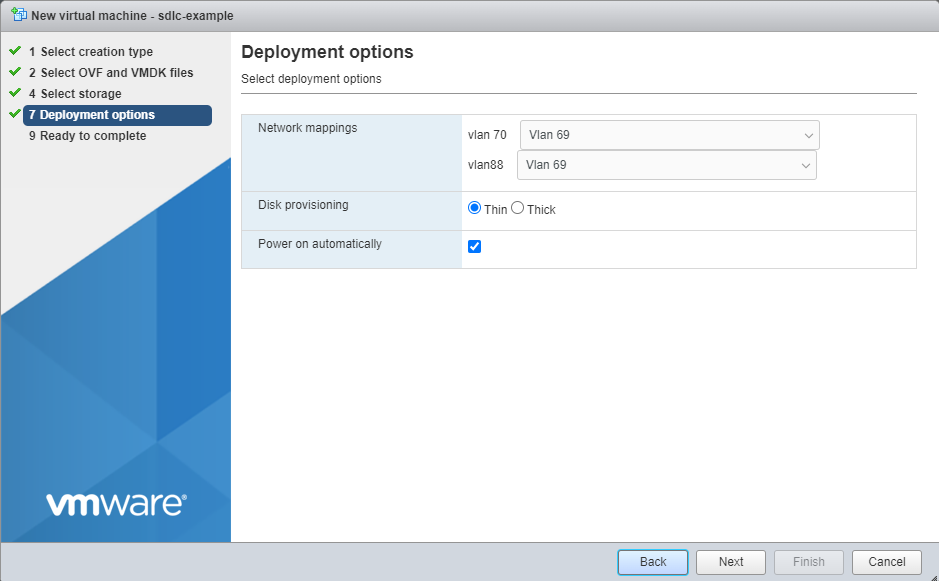
- Set the deployment options. Click Next.
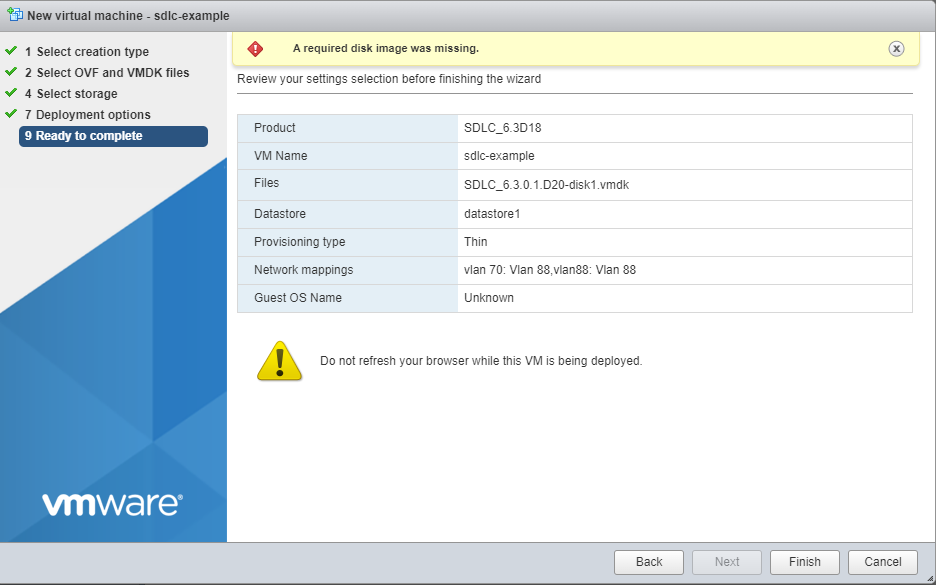
- Review the settings and if they are correct, click Finish.
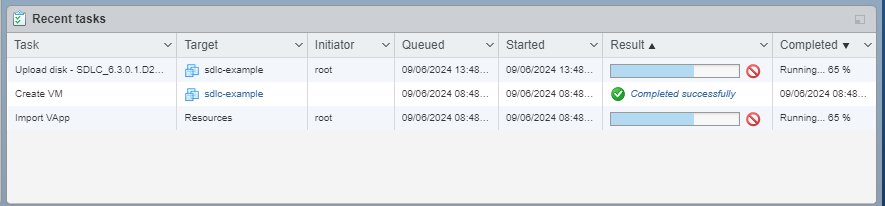
- The VM creation process will start. Wait until you see the message Completed Successfully.
Configure SDLC (Console)🔗
The SDLC must be configured with a Static IP address and the vNetC FQDN.
- Select the SDLC from the VMWARE ESXi interface and click the Console tab.
- Select Open browser console.
-
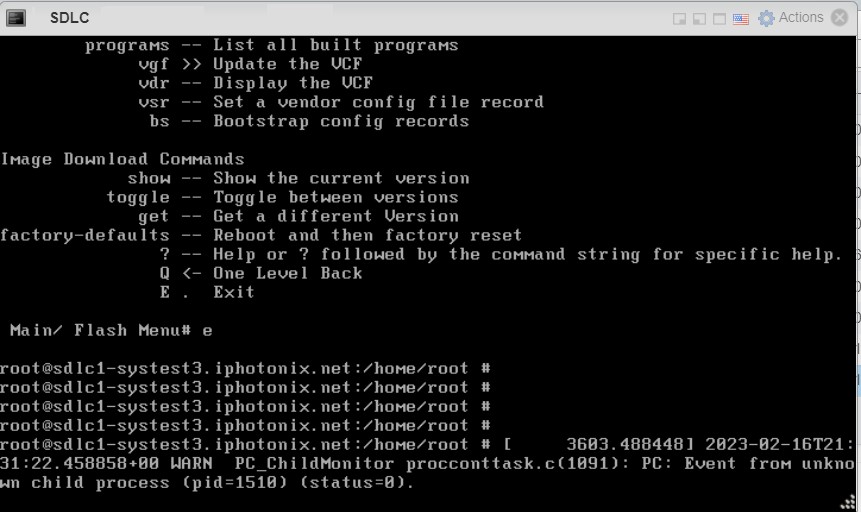
The console appears.
DHCP Error Messages
During the following process DHCP errors may appear. These can be ignored.
-
Press Enter to get the login prompt, enter username: admin and password: admin.
- At the command line interface (CLI) press Enter to see a list of options.
- Select admin and press Enter.
- Type Wizard and press Enter.
Note
If vNetC and SDLC (Backend Services, ACS) are on different subnets, it is recommended to have three consecutive static IP addresses on the same subnet for Backend Services, ACS and DHCP. However, if vNetC is on the same subnet as Backend Services, ACS and DHCP, it is recommended to use four sequential IP addresses.
| Prompt | Answer |
|---|---|
| Enter new hostname | SDLC |
| Enter MGMT IP or enter 'd' to use DHCP | Enter management IP |
| Enter URL connection protocol (http, https) | http |
| Enter default gateway IP/Prefix in CIDR format | Enter the default gateway IP address |
| Enter ACS IP or type 'none' to remove config | Enter IP |
| Enter vNetC FQDN or IP | vNetC IP address |
| Enter DNS server | Enter DNS server IP |
| Enter comma separated NTP server(s) | Enter vNetCs IP address |
| Advertise Site Management vlan | Enter n |
| Enter VnetC post SN | Enter N/A |
| Enter ACS url | Press Enter or Enter a different url |
- Type y and press Enter
- Reboot is required for any changes to take effect. In the console, type reboot and press Enter.
Power On the vNetC🔗
- In the VMware ESXi interface power on the vNetC. This takes a few minutes.
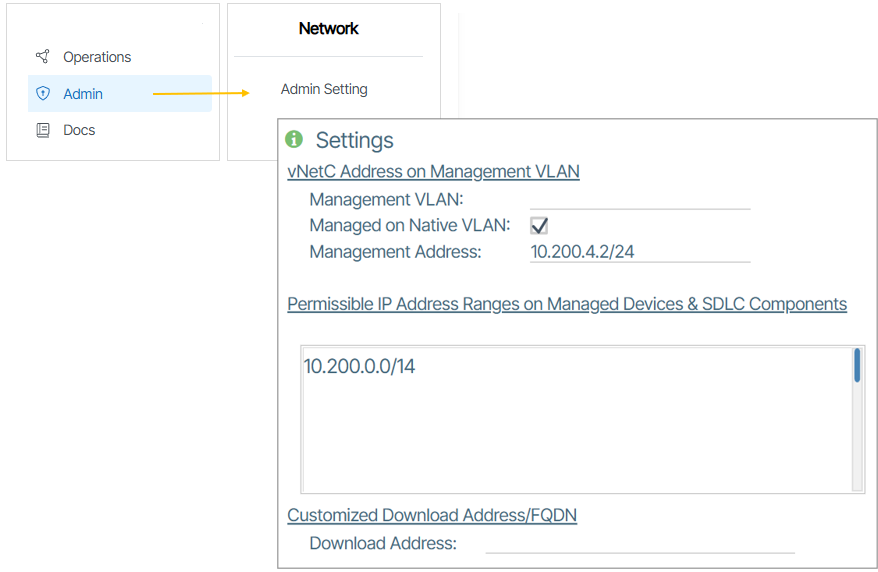
- Open the GUI and select select the Admin Settings option.
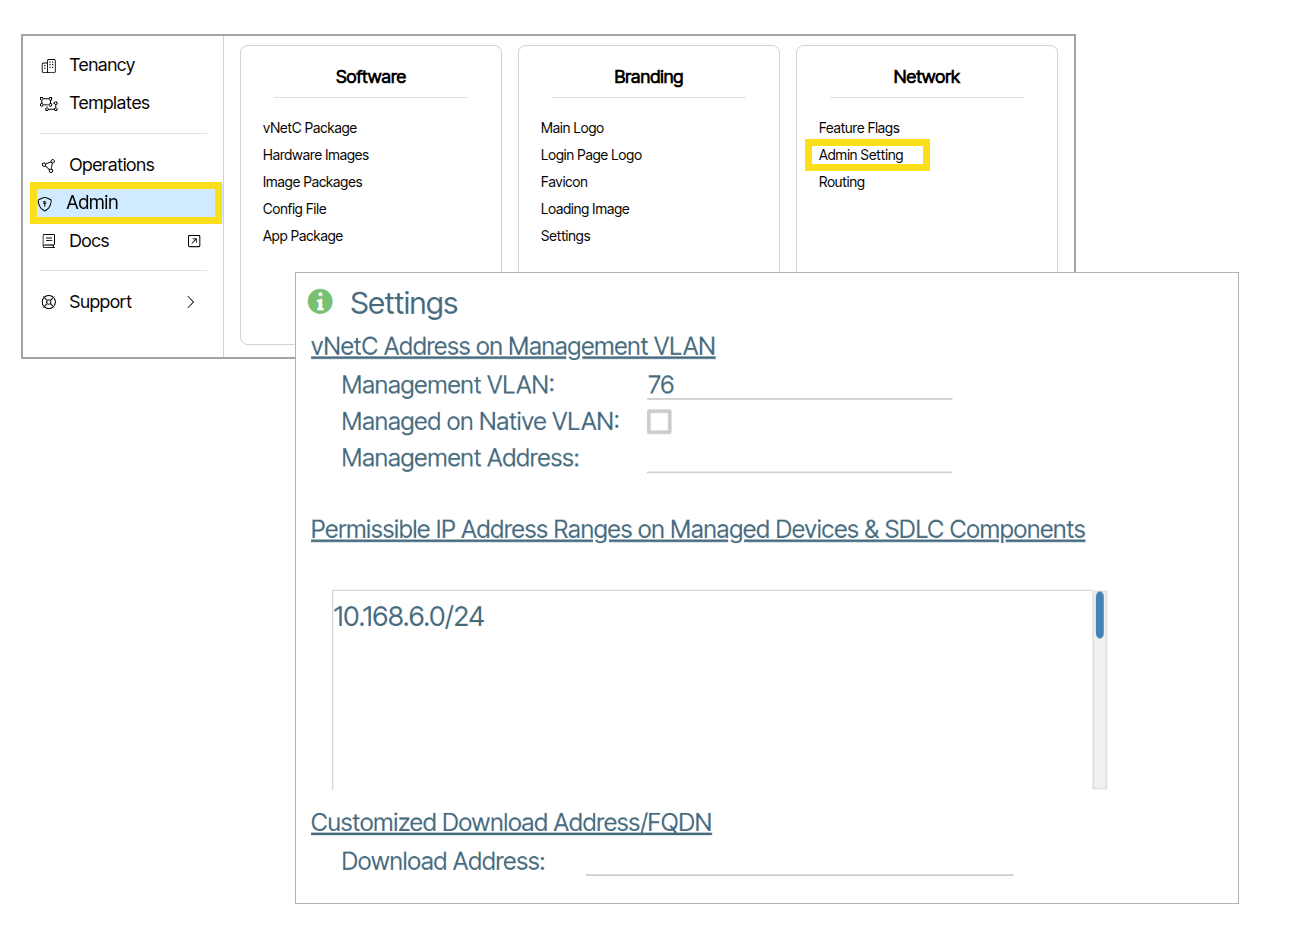
- Set up the Management VLAN used to access the Management network. This field is required even if your management switches are using untagged connections.
-
For Permissible IP Address Ranges on Managed Devices enter the relevant IP address range (IP address and Mask).
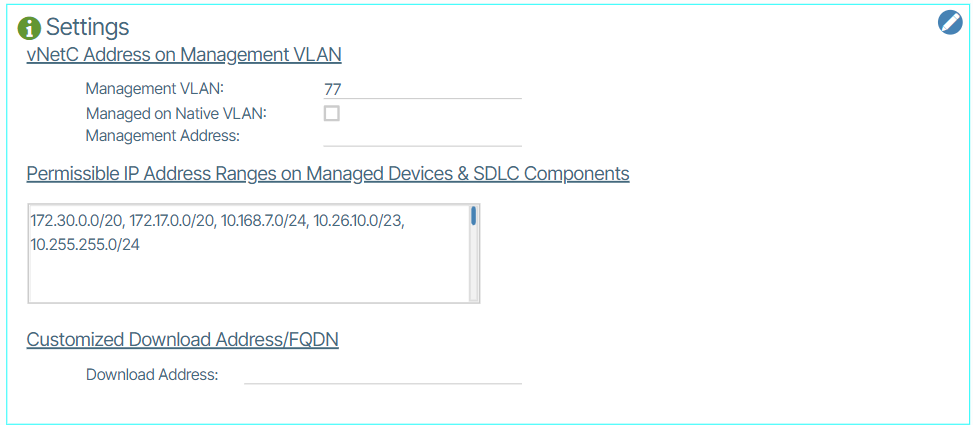
Permissible IP Range Requirement
The range entered MUST include SDLC components.
-
Click the Save button to save your settings. (
 ).
). - Wait until the process is finished. The application landing page resembles the image below when all processes have been completed.
Update SDLC🔗
Note
For file transfers to the system for SDLC and other components, users can scp directly to the system as opposed to using file drag-n-drop. Files should be transferred to /var/n/direct location. After successful transfer, the "deploy" button show on the screen as it does after using GUI to transfer files.
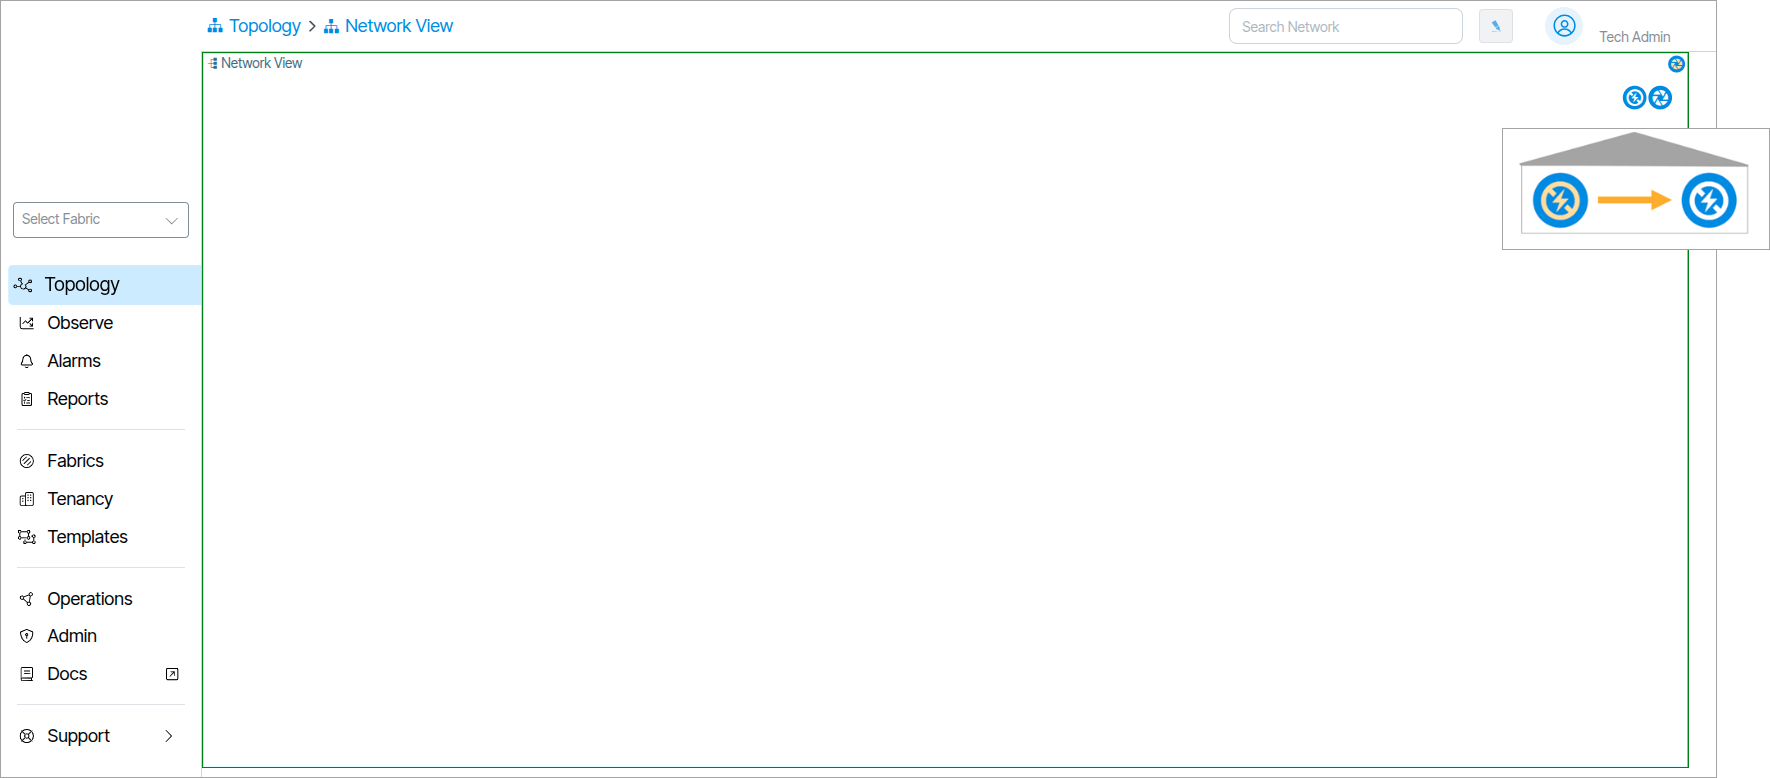
- In Topology/Topology set the Upgrades selection button to the Enable setting
 .
. - Click the Admin tab. Under the Software Packages column double-click Image Packages.
- Select and place the SDLC Binary Firmware Upgrade firmware file on the Drag & Drop area or use the Browse Files button to select the file.
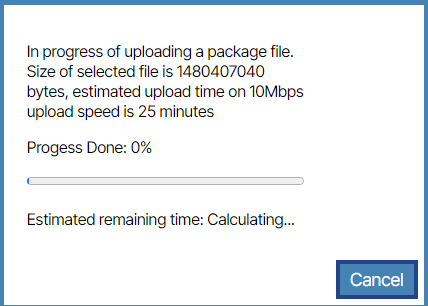
- When uploaded, you are prompted with a green success message.

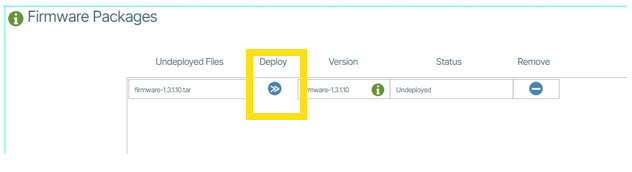
- Deploy the upgrade by clicking the Deploy button.
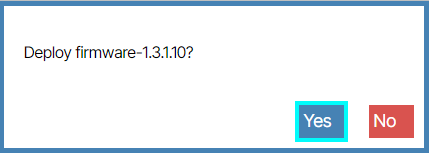
- A validation message appears. Click Yes.
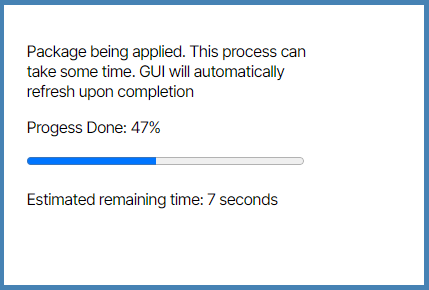
- Wait while the package is applied.
- Click Admin and click VNFs .
- Double click the SDLC section.

- Double click the box with the title of SW Version.
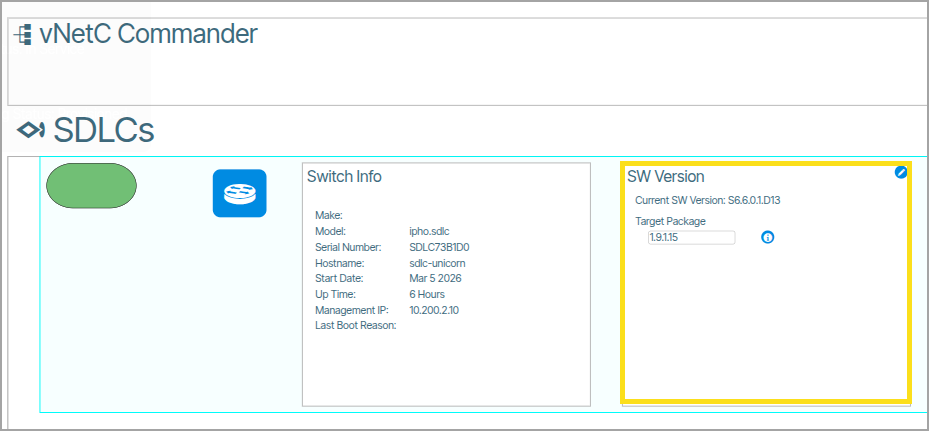
- Set the Target Package field to the Firmware version
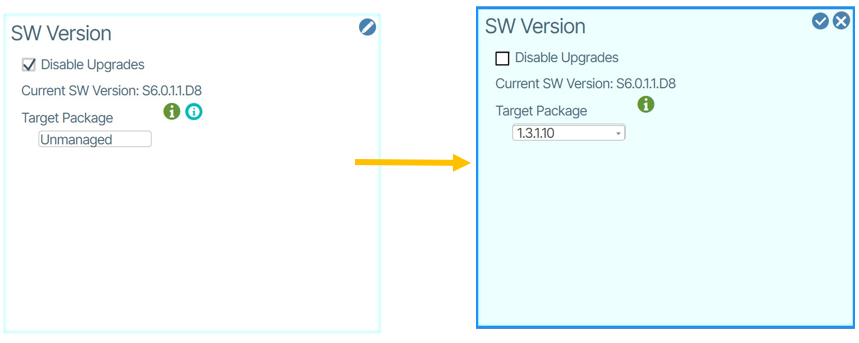 .
. - Click the Save button ().
- Click Yes to the validation message.
- Let the process complete.
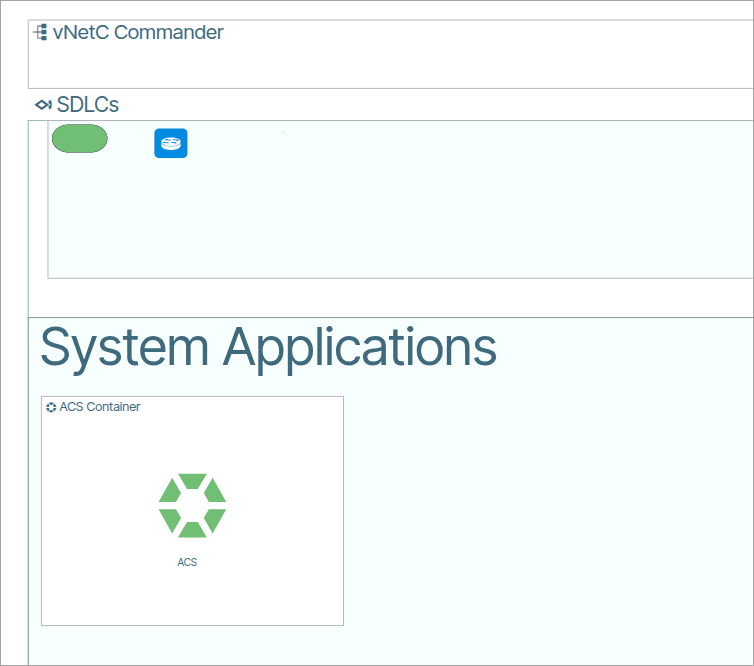
- When the window appears the initial state of System Applications are offline. When the System Applications come online their LED icons render green. This may take up to 5 minutes. Admin/VNFs
Site Certificate🔗
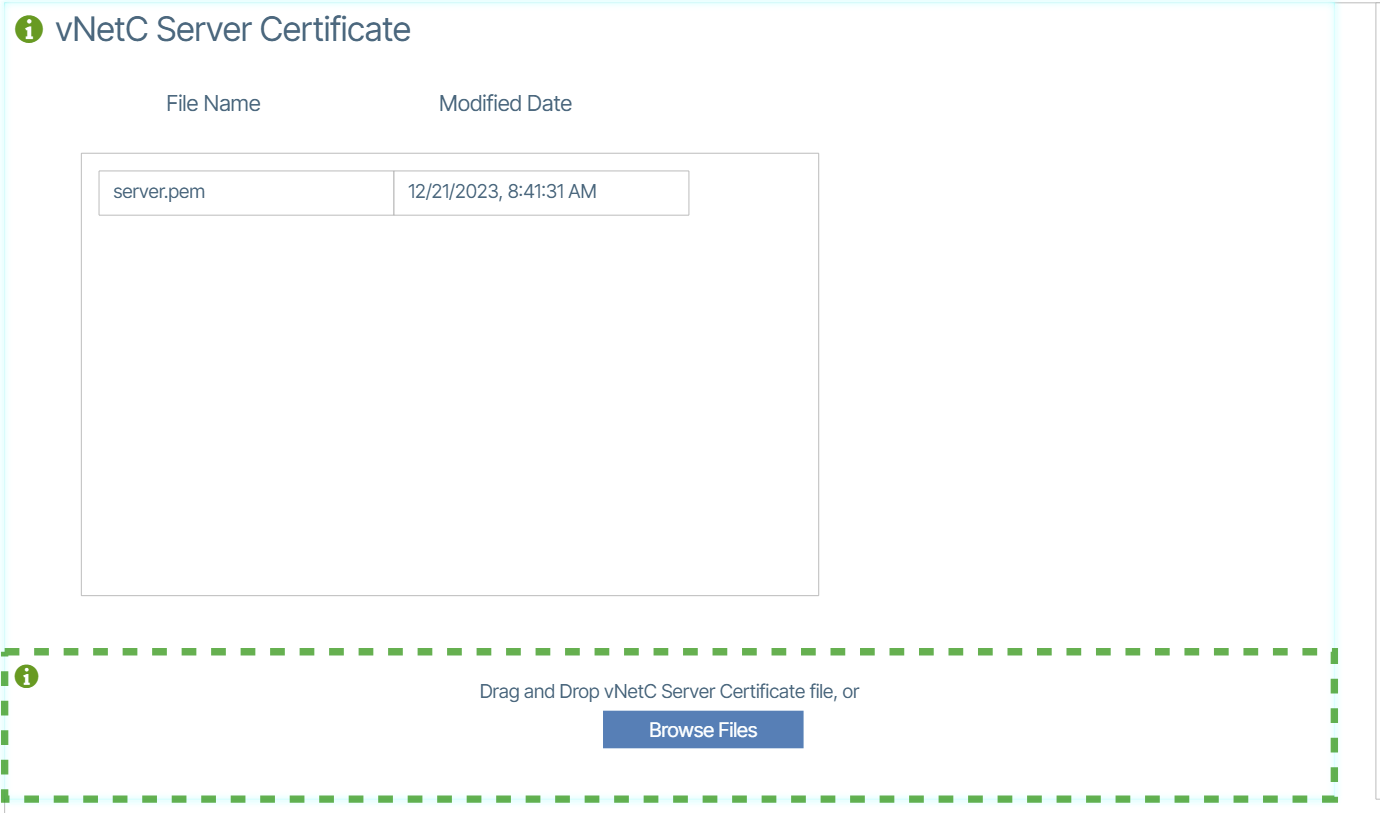
In order to avoid having to accept the self signed certificate delivered with the system you will need to add a server.pem file to the system. This will need to be obtained from your internet domain administrator.
The certificate contains the private key, has FQDN set as the common-name, and a certificate authority chain.
- Go to Admin.
- Under Certificates click vNetC Server Certificate.
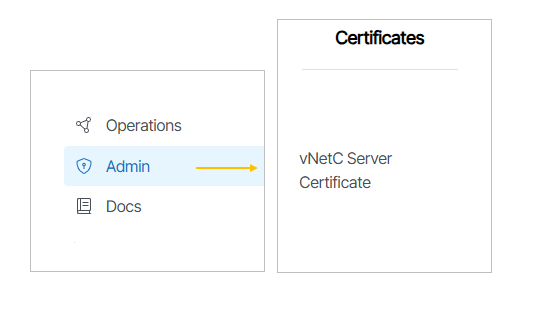
- Drag and drop the server.pem file.
Install Monitoring VM🔗
- Go to Virtual Machines.
- Click Create/Register VM.
- In the window that appears select Deploy a virtual machine from an OVF or OVA file.
- Click Next.
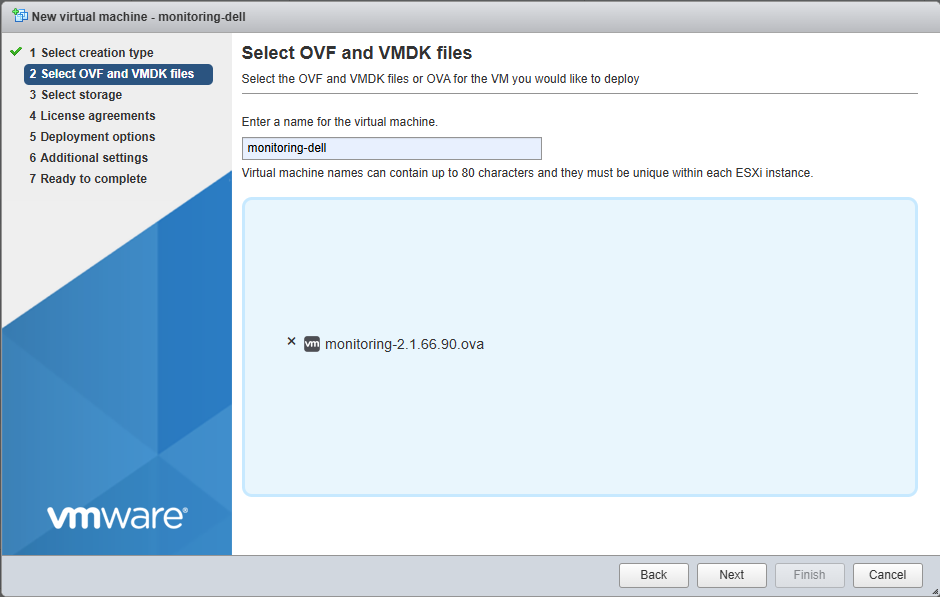
- Enter a name for the VM and upload the vNetC VM Image OVA file via the prompt that says Click to Select file or drag/drop.
- Click Next.
- Select the desired data store options. Click Next.
- Click Next.
- Set the Deployment options and network mappings to the correct Port Group. .
- This Port Group must be set to promiscuous mode.
- Click Next.
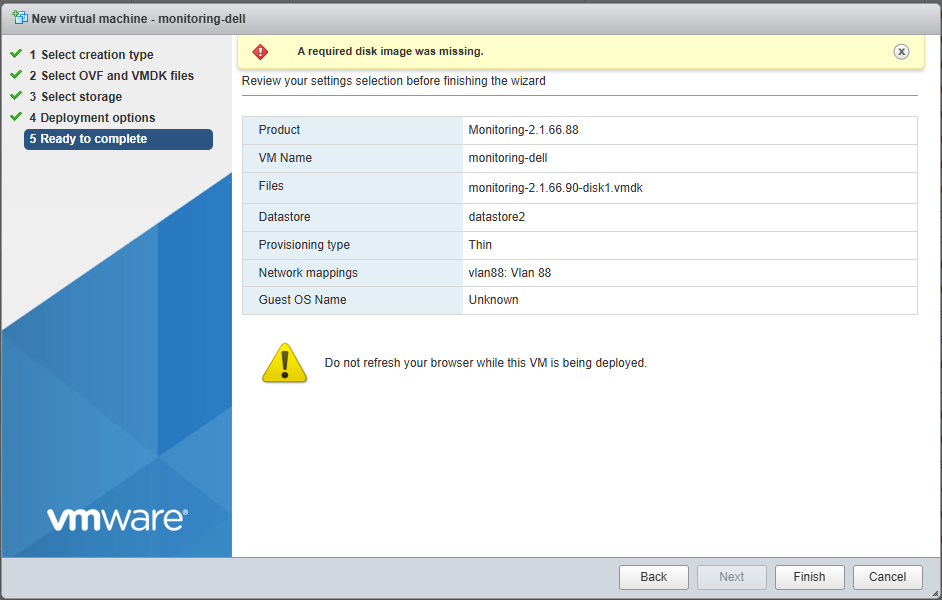
- Review the settings and if they are correct.
- Click Finish.
- The VM creation process will start. When the process completes the progress bar in Recent tasks at the bottom of the screen will say Completed Successfully.
Configure Monitoring VM (Console)🔗
Prerequisites🔗
- Network Configuration: You must configure the settings at Admin/Admin Setting (
 ) to allow access for the subnet where Monitoring will be installed.
Installation & Setup🔗
This step requires you to configure Monitoring with an IP address, default gateway, and DNS servers. Then the script will ask for the Fully Qualified Domain Name (FQDN) of the VNetC so it knows how to connect the Monitoring dashboard. To do so, you need to open the VM console.
- Select your VM under the Virtual Machine column and click Console/Open browser console.
- The VM console appears. The Monitoring initialization may take several minutes. While waiting, you can press Enter and wait for login prompt.
- Login to Monitoring with username verity and password vnc1234.
- Enter a new password. Remember this password.
- You will see the following interface:
    ****************************************
    Welcome to the Monitoring Admin Menu
    ****************************************

    Please choose an option:
    1) setup
    2) troubleshooting
    #?
Monitoring Admin Menu🔗
Option 1: Setup🔗
Purpose: Executes the system setup process
When to Use:
- Initial system configuration
- Reinstalling or reconfiguring components
- Setting up new environments
Troubleshooting
For further information about Troubleshooting, visit the Troubleshooting section.
Select Setup🔗
- When prompted with
#?, enter the number corresponding to your choice: 1 forsetup. -
Press
Enterto confirm your selection -
Select management network interface and press Enter.
-
When prompted, enter the following information:
- Enter static IP Address and subnet in CIDR format (x.x.x.x/#)
- Default Route (Gateway)
- DNS Servers separated by a comma
- Enter the hostname of the server
- Enter the FQDN or IP address of the vNetC host.
- Enter TogetherAI key (if applicable).
-
Setup of Monitoring is complete. The display will show the current settings and provide a message on how to make changes in the future.
-
Select y/n to configure email notifications. This is optional.
After you set the email notification options you are presented with a prompt that states Starting Docker Containers. Wait for this to complete.
-
Setup of Monitoring is complete. The display will show the current settings and provide a message on how to make changes in the future.
-
Type sudo reboot to reboot the VM for all the settings to take effect. After the reboot, it takes about 3 minutes for the Docker containers to start up and to announce itself to the vNetC.
-
When the Monitoring VM connects to the vNetC, in Verity, a Growl with the MAC Address of the Monitoring VM will appear. Once this does, use the refresh button on Chrome.
-
There will be a new Observe menu option available. Also, the Observe Dashboard will be the new startup screen.
Upgrade to the Latest Monitoring Software🔗
Warning
After completing the previous installation steps, the user must install the latest software as outlined below. The installation process is not considered complete until this final step is finished.
- Use Chrome Web Browser to access the vNetC IP address that was just configured.
- At the login prompt enter username admin and the administration password configured in the menu during installation. These are the credentials you entered in step 3 of Configure the vNetC from the Console.
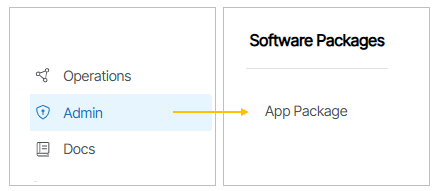
- From the Admin web page and under the Software Packages heading, click App Packages.
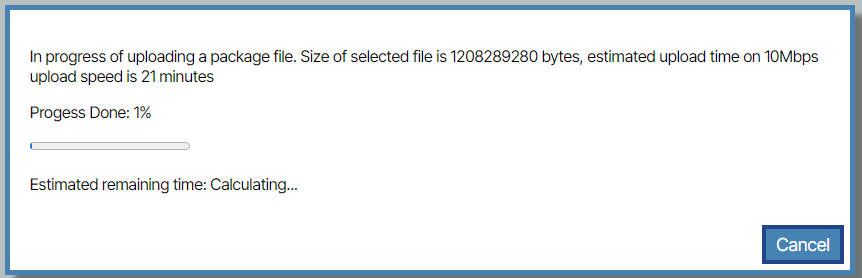
- Using the Browse Files (or drag and drop) field, import the Monitoring Upgrade file provided by customer support.

- When the process is complete you are presented with a success message.


- Click the Deploy button.
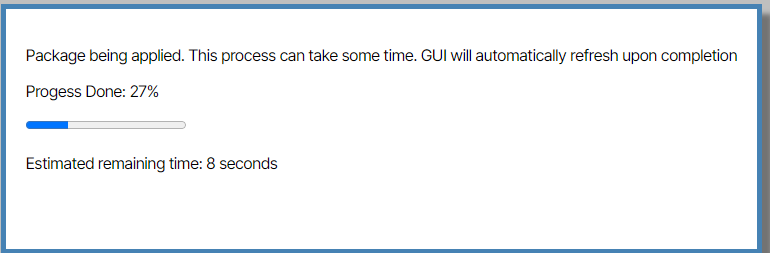
- When prompted to continue, click Yes. The software updates.
Wait for System
It take about 5 minutes for the tarball to be uploaded to the Monitoring VM, and the changes to be applied and the new containers started up. If you SSH into the Monitoring VM, and go to the /be_install directory, you will see the tarball uploaded. If you run sudo docker ps you will see the uptime of the containers to be less than 5 minutes online letting you know that everything is updated.
Congratulations
Verity has been successfully installed. Treat yourself to an iced coffee!
Monitoring Advanced Options🔗
Overview🔗
Customer needs Prometheus and AlertManager data forwarded to external sources with TLS security enabled. AlertManager requires alert duplication to a new receiver with added security. Prometheus exposes a built-in /federate endpoint for external scraping. A future enhancement to fetch certs from a vault is noted to eliminate manual cert rotation.
Reference docs:
Scenario 1 — AlertManager webhook receiver behind TLS🔗
Edit user-config.yml (the ytt data values file). Two approaches depending on required control level.
Option A — notification_receiver_integrations (simplest)🔗
Leverages built-in overlay logic. Auto-creates a receiver and a matching route for job="alarm_manager_notification" alerts, generating a receiver named notification-webhook-0 with continue: true.
# user-config.yml
notification_receiver_integrations:
  webhook_configs:
    - url: "https://customer-noc.example.com/alerts/webhook"
      send_resolved: true
      http_config:
        tls_config:
          ca_file: "/etc/alertmanager/certs/ca.pem"
          cert_file: "/etc/alertmanager/certs/client.pem"
          key_file: "/etc/alertmanager/certs/client-key.pem"
          insecure_skip_verify: false  # set true for self-signed certs (not recommended in prod)
Option B — additional_receivers + additional_routes (full control)🔗
Use when custom matchers are needed or alerts beyond alarm_manager_notification must be routed.
# user-config.yml
additional_receivers:
  - name: customer-tls-webhook
    webhook_configs:
      - url: "https://customer-noc.example.com/alerts/webhook"
        send_resolved: true
        http_config:
          tls_config:
            ca_file: "/etc/alertmanager/certs/ca.pem"
            cert_file: "/etc/alertmanager/certs/client.pem"
            key_file: "/etc/alertmanager/certs/client-key.pem"
            insecure_skip_verify: false
          # basic_auth:          # optional if webhook requires it
          #   username: "vendor"
          #   password: "s3cret"

additional_routes:
  - matchers:
      - severity=~"critical|warning"
    receiver: customer-tls-webhook
    continue: true
Mount TLS certs into the AlertManager container🔗
Add a volume bind in the Docker Compose override so cert files are accessible at the paths referenced above.
# docker-compose override
alertmanager:
  volumes:
    - /path/to/customer/certs:/etc/alertmanager/certs:ro
Re-render and reload after editing🔗
- Render the final
alertmanager.ymlvia ytt:./utilities/render_alertmanager_config.sh - Reload AlertManager (or restart the container):
curl -X POST http://localhost:9093/-/reload
Scenario 2 — Customer scraping the Verity Prometheus federate endpoint🔗
The customer adds this job to their own Prometheus config to pull selected time-series from the Verity Prometheus instance.
# Customer's prometheus.yml
scrape_configs:
  - job_name: 'federation'
    honor_labels: true
    metrics_path: '/federate'
    scrape_interval: 30s
    scrape_timeout: 25s
    params:
      'match[]':
        - '{job="telegraf"}'                        # all telegraf-collected switch metrics
        - '{__name__=~"ALERTS|ALERTS_FOR_STATE"}'   # alert-related metrics
        - '{__name__="ifHCInOctets"}'               # cherry-pick a specific metric
    static_configs:
      - targets:
          - '<vendor-prometheus-host>:9090'
    # if Verity Prometheus is behind TLS or basic auth:
    # scheme: https
    # basic_auth:
    #   username: "federation_user"
    #   password: "s3cret"
    # tls_config:
    #   ca_file: "/etc/prometheus/certs/cert-ca.pem"
    #   insecure_skip_verify: false
Key points🔗
honor_labels: true— preserves originaljob,instance, etc. labels from Verity instead of overwriting them with the federation job's labels.match[]— scope to only the series needed. Pulling everything ({__name__=~".+"}) is expensive and defeats the purpose of federation.scrape_interval— 30s is a reasonable default; should not exceed Verity's own interval (currently 15s for telegraf, 5s for sflow-rt).- Firewall — port
9090on the Verity Prometheus host must be reachable from the customer's Prometheus. A reverse proxy or VPN tunnel may be needed if the instance is not externally exposed.
Alert Manager🔗
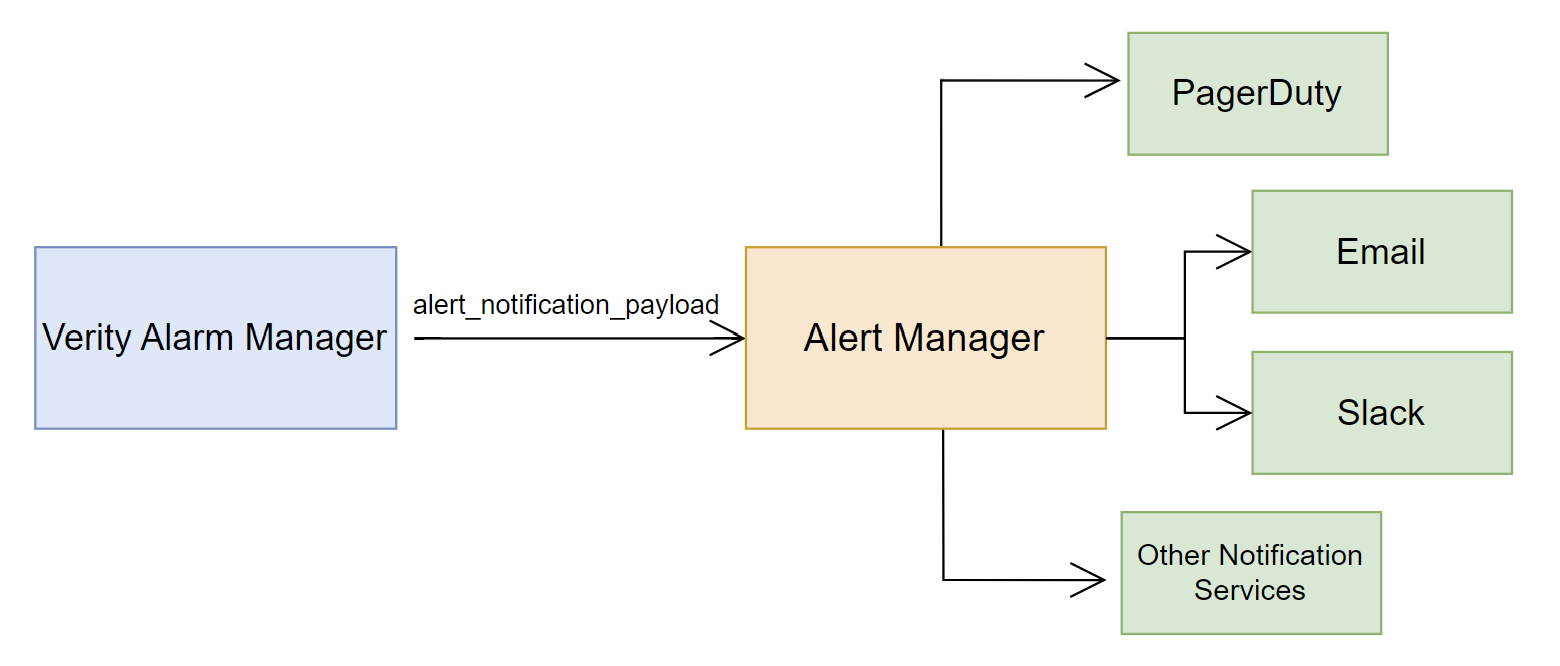
Alert Manager is a configurable tool that allows you to forward Verity alarm data to third-party messaging services such as email, PagerDuty, Microsoft Teams, and others.
The following diagram represents the relationship between Alarm Manager, Alert Manager, and an arbitrary collection of connected messaging services.
Process🔗
The process for editing AlertManager is:
- Edit
/be_monitoring/alertmanager/user-config.yml(email/receiver settings) - Run
/be_monitoring/utilities/render_alertmanager_config.shto apply
Example: Email notifications via SMTP
#@data/values
---
smtp:
  smarthost: "smtp.company.com:587"
  from_address: "alerts@company.com"
  auth_username: "alerts@company.com"
  auth_password: "s3cretP@ss"
  require_tls: true

notification_email:
  to: "noc-team@company.com"
  send_resolved: true
Example: Adding a Slack integration
notification_receiver_integrations:
  webhook_configs:
    - url: "https://my-ticketing-system.com/api/alert"
      send_resolved: true
Example: Adding a fully custom receiver + route
additional_receivers:
  - name: critical-pagerduty
    pagerduty_configs:
      - service_key: "abc123"
        send_resolved: true

additional_routes:
  - matchers:
      - severity="critical"
    receiver: critical-pagerduty
    continue: false
Applying changes
run /be_monitoring/utilities/render_alertmanager_config.sh
This:
- Merges vendor config + user values + overlay via
ytt - Writes the final alertmanager.yml
- Reloads Alertmanager via
POST /-/reload - Persists user configs to
/be_install/archive/for upgrade survival