Diagnostics🔗
Monitoring ACL🔗
Monitoring ACLs select Service VLAN traffic for diagnostic monitoring. A Monitoring ACL references one or more Services; the VLANs from those Services are then available to monitoring policies. The Monitoring ACL can be set in Diagnostic Profiles and Traffic Mirrors.
Create a Monitoring ACL🔗
- Click Templates.
- In the Diagnostics section, click Monitoring ACL.
- Click the Add Monitoring ACL button to create a new Monitoring ACL.
- Enter the Monitoring ACL name, then create the object.
- In the Services section, add each Service whose VLAN traffic should be selected for monitoring.
- Toggle the Enable switch to enable the object.
- Click Save (
 ) in the Edit Mode prompt.
A Service may only be added once within the same Monitoring ACL.
Monitoring ACL Report🔗
The Monitoring ACL report view shows the configured ACLs and their referenced Services. User-visible columns include Service Count, Service, and VLAN, which can be used to verify which Service VLANs are selected for diagnostic monitoring.
Use a Monitoring ACL with a Traffic Mirror🔗
Traffic Mirrors can reference a Monitoring ACL to mirror only the Service VLAN traffic selected by that ACL.
When configuring a Traffic Mirror on a switch endpoint, set the Monitoring ACL field to the Monitoring ACL whose Service VLANs should be mirrored. The Traffic Mirror report includes a Monitoring ACL column so you can verify which ACL is applied to each mirror entry.
Traffic Mirror source ports also support an All interfaces option. When selected, the mirror source is displayed as All interfaces in the topology and reports, and CSV import/export uses the value all in the MIRROR SOURCE PORT column.
Diagnostics Profiles🔗
Diagnostics Profiles are device level templates that enable and configure sFlow and ERSPAN monitoring on network switches, including settings for collectors, polling intervals, VRF types, Monitoring ACLs, and ERSPAN destinations.
Diagnostics Port Profiles🔗
Diagnostics Port Profiles are port level templates that control which individual switch ports send sFlow traffic data to the configured collectors.
sFlow🔗
sFlow is a configurable feature in Dell Enterprise SONiC that enables administrators to monitor network traffic using flow based sampling.
Feature
This feature is only available for systems devices running Dell Enterprise SONiC OS.
Enable sFlow Exports🔗
Step 1: Configure sFlow Collector(s)
- Double-click Templates.
- Click sFlow Collectors.
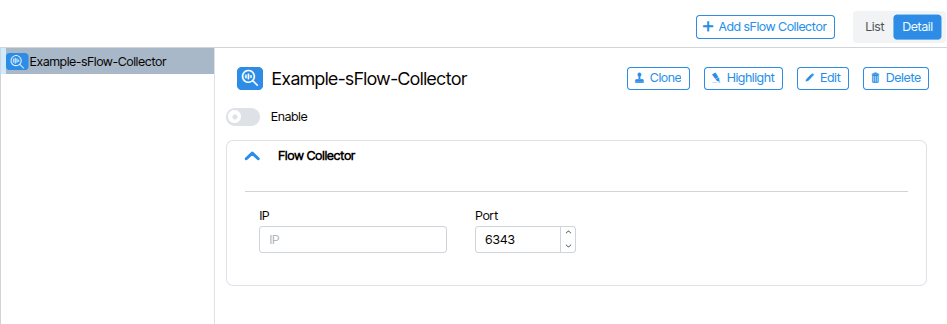
- Click the Add sFlow Collector button to create a new sFlow Collector.
- Enter the collector name, then click Create SFlow Collector. (
 )
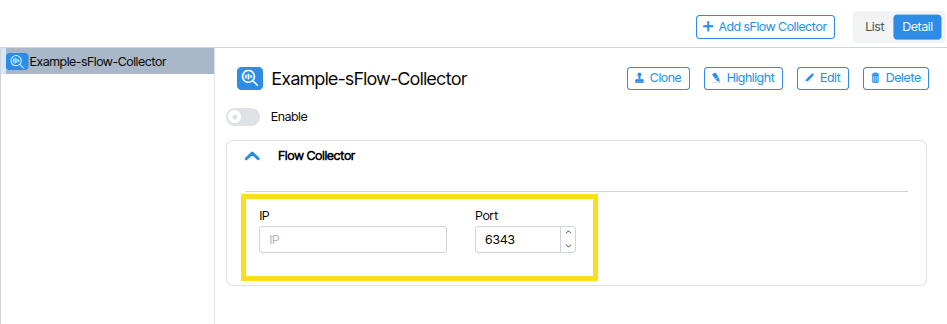
) - Set:
- Flow Collector IP Address
- Port Number (Default: UDP 6343)
- Toggle the Enable switch to enable the object.
- Click Save () in the Edit Mode prompt.
Step 2: Assign Collector to a Diagnostic Profile
- Double-click Templates and click Diagnostic Profiles.
- Click the Add Diagnostics Profile button to create a new Diagnostic Profile.
- In the pop-up window type a name and click Add Diagnostics Profile.
- In the parameters window, configure the following parameters:
- Enable: Toggles the Diagnostic Profile on/off (set it to enabled).
- Enable sFlow: Enables sFlow for this profile (set it to enabled).
- Collector: Select the desired sFlow Collector (set it to the Collector you created in the previous steps)
- Poll Interval: Interval (in seconds) for traffic sampling or counters. Range: 5–300 (default: 20).
- VRF Type: Choose Management or Underlay, depending on your network architecture.
Step 3: Assign the Diagnostic Profile to Device(s)
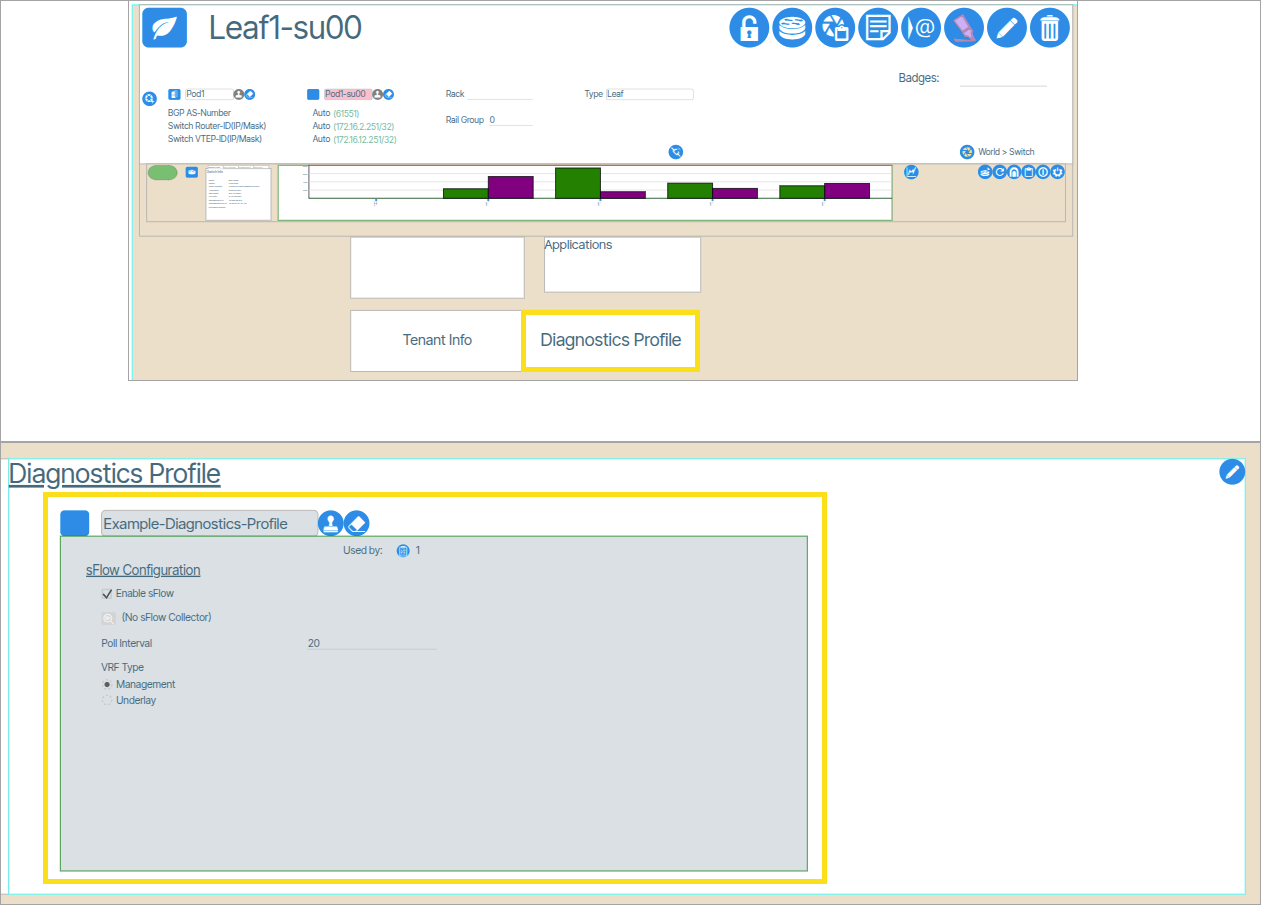
- In Topology from Network View, select the switch you want to monitor.
- Double-click the switch to zoom in.
- At the top of the device double-click the Diagnostic Profile window, assign the appropriate Diagnostic Profile (the one linked to your sFlow Collector).
Step 4: Configure Ports to Send Data to Collector(s)
- Double-click Templates and click Diagnostic Port Profiles
- Enable the Diagnostic Port Profile and Enable sFlow .
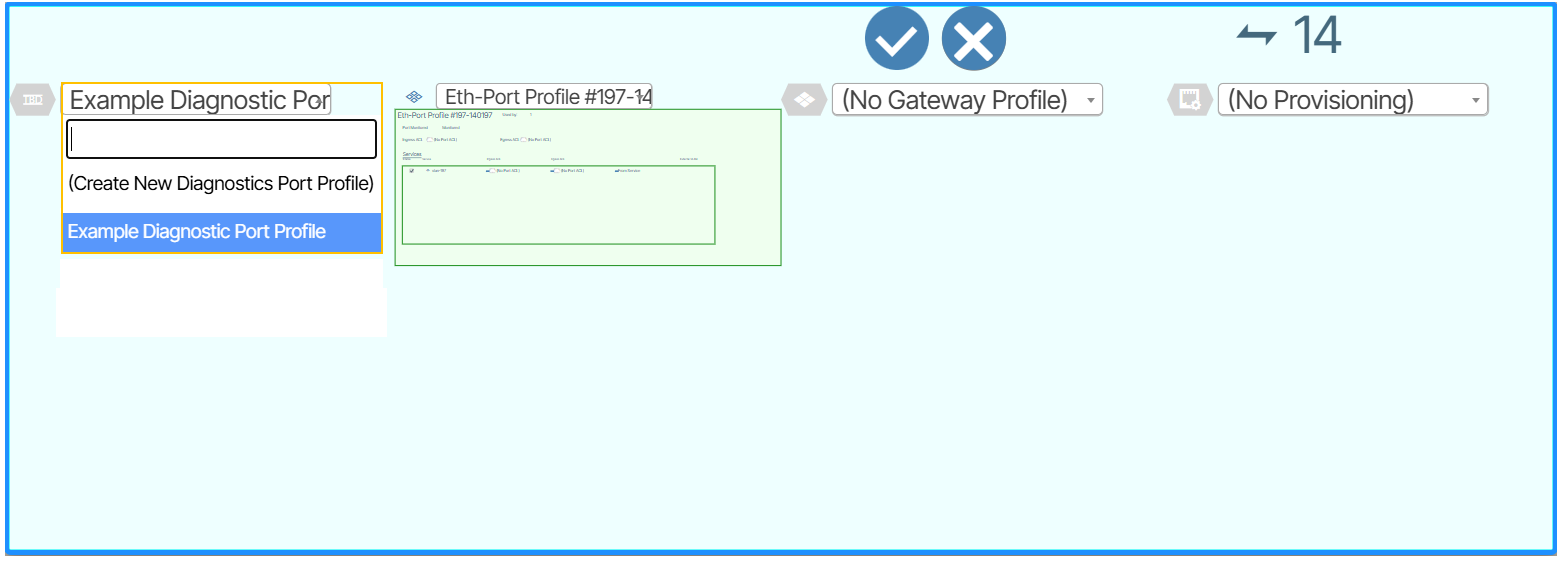
- Navigate to the switch port(s) connected to your monitored device or collection path and double-click (or zoom in) on it.
- Double-click the port's endpoint to open configuration options.
- In the Diagnostic Port Profile menu assign the appropriate Diagnostic Profile to the port.
PB Egress Profiles🔗
PB Egress Profiles are groups of filters applied to Packet Broker egress connections.