System Graphs🔗
The System Graphs display system wide information such as Service Port activity and virtual machine performance statistics on the UI. Graph types, subtypes and time ranges can be changed at any time. The user saves by clicking on the double check mark icon in the top right. The graph selections are saved per user. There are many System Graphs. Below are a few select examples of this feature. To access graphs click the System Graphs ( ) icon.
System Graphs Availability
The System Graphs navigation panel is only available to systems that do not have Satori installed. For systems with Satori enabled, the System Graphs navigation panel is replaced by the Satori navigation panel.

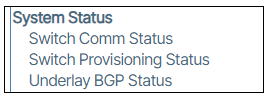
System Status🔗
System Status displays the number of underlay connections for each status type, including those that are up, unstable, preprovisioned, and down.
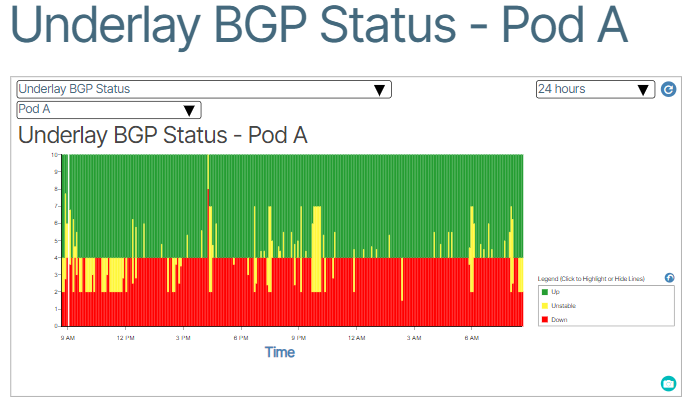
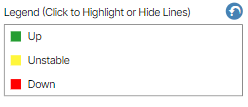
The Legend provides data lines for unstable, down, preprovisioned and up. Data lines can be shown, highlighted, or hidden by clicking the square icon next to each item.
SDLC Statistics🔗
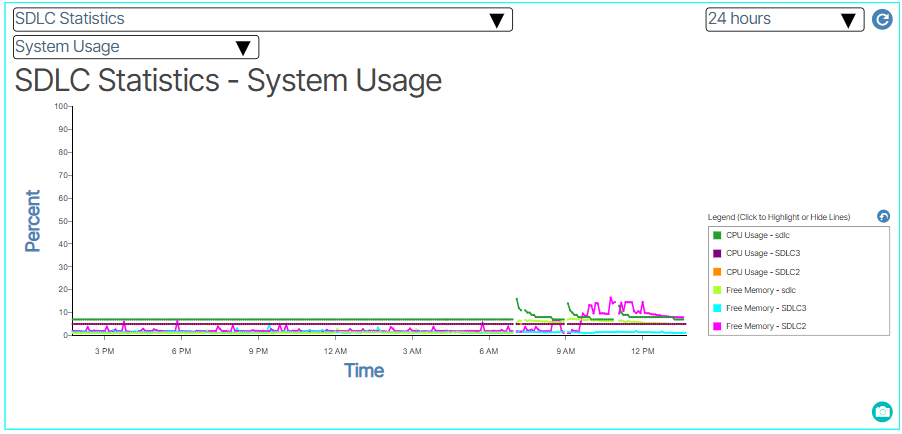
SDLC Statistics include:
- System Usage
- Load Average
- Memory
- File System
- Uptime
WebSocket Traffic System Graph🔗
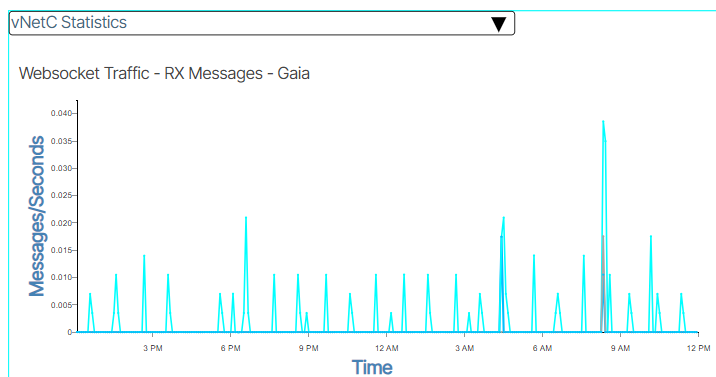
The WebSocket Traffic System Graph provides a visual representation of web socket data, ensuring visibility between different system components. This is primarily intended as an internal engineering tool.
To view the WebSocket Traffic System Graph, follow these steps:
- Select a Graph from the UI.
- Set the Service Port Graph field to vNetC Statistics.
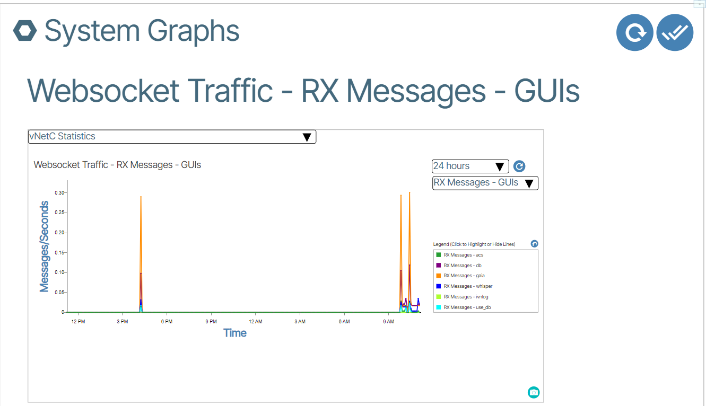
- Select a value from the vNetC WebSocket Traffic field.
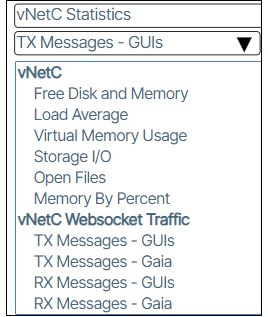
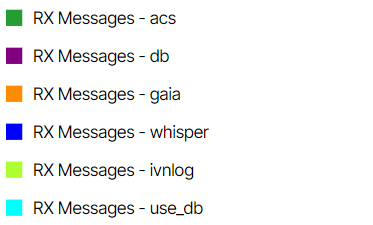
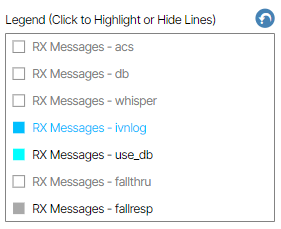
- To toggle data visualization by component(s), click the color boxes in the Legend.