Slice
Current Slice🔗
Slice view is the main troubleshooting pane. It displays the end-to-end view of services being delivered to the ports on the service Endpoint device. It shows the connectivity between all the network components used as well as the relevant provisioning objects to deliver the service. Zooming into the various components gives you more detail about that component. Optical levels are displayed for the optical connections between devices. Essentially, if there is a problem delivering a service to an end user port, the information leading to the disruption is in this single pane. MAC workbench and system logs can be interrogated directly from the slice view focusing on activity relevant to the devices in the slice.

Filter Slice on Reports🔗
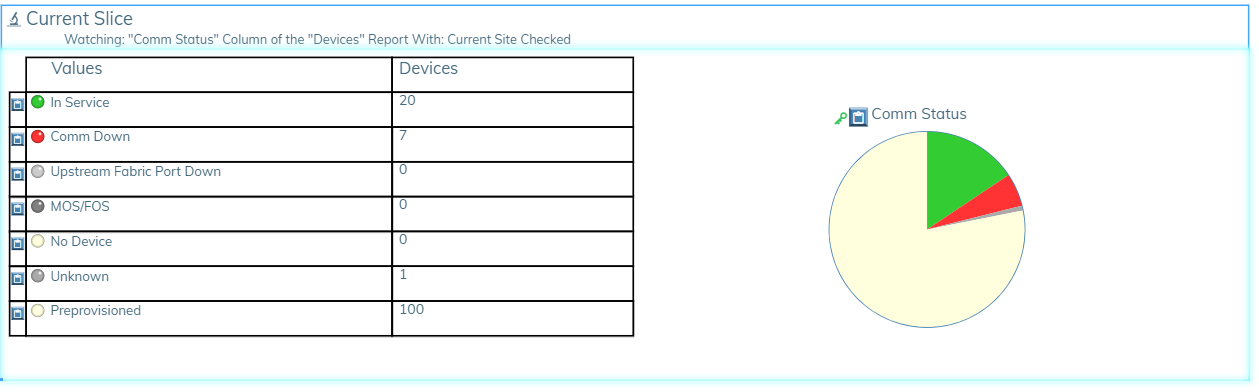
This feature lets you apply a filter to specific report data and to view the data as a pie graph. Filter Slice on Reports is only available to specific report data.
To use the feature, choose a column of report data and click the slice icon.

A pie graph of the chosen data is rendered to the screen.