Visualizations🔗
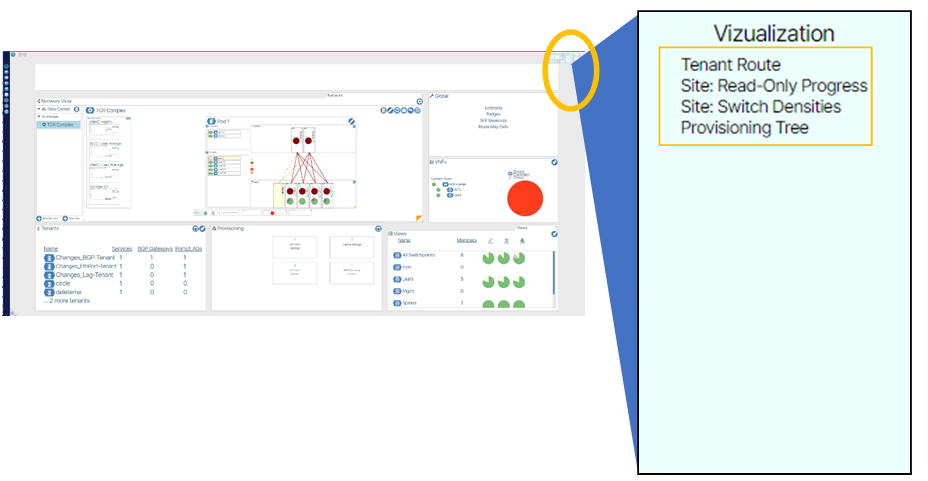
The Visualization feature provides graphical representations of various device details. To use Visualization, open the mini map from the world view and select an option under Visualization.
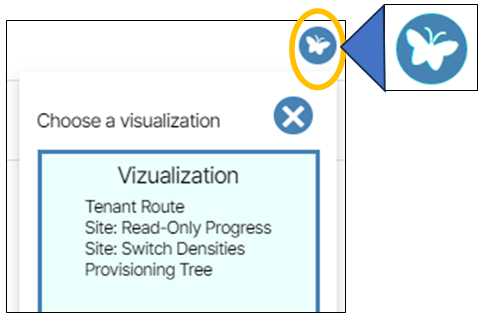
In addition to launching the Visualization feature from the mini-map, you can also open it by clicking the “Open Visualization” button, identified by a butterfly icon.
Diagrams🔗
The following sections describe the data representation of each diagram.
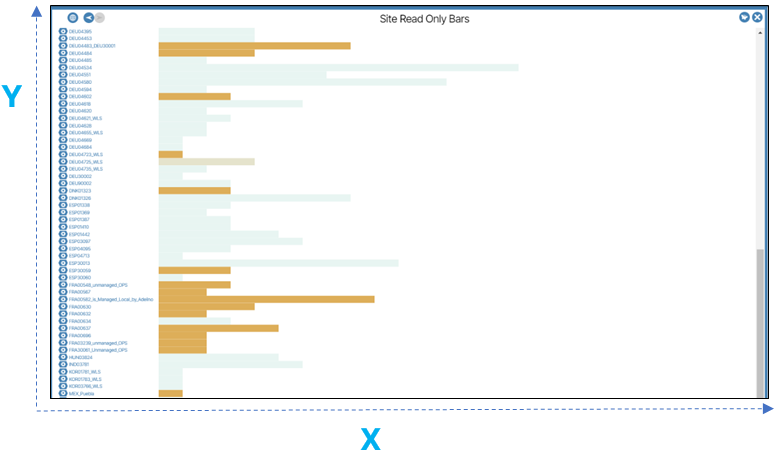
Site Read Only Progress🔗
For each site in a multi-site system, this diagram expresses the contrast between switches that are read-only and provisioning. It allows you to assess the provisioning progress of a site.
Site read only (multisite only): describes read only (brown) to provisioning (light blue) progress per site.
- x-axis: Number of switches
- y-axis: List of sites
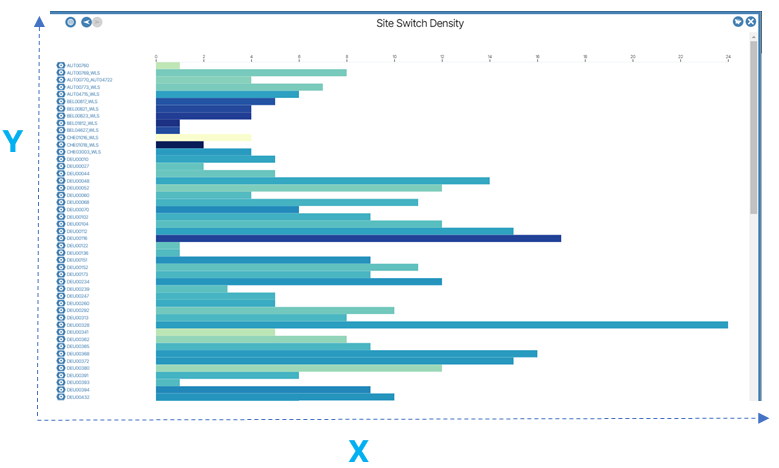
Site Switch Density🔗
For each site in a multi-site system, this diagram expresses the contrast between the number of switches between sites.
Site switch density (multisite only): Darker colors represent higher density, and lighter colors represent lower density.
- x-axis: Number of switches
- y-axis: List of sites
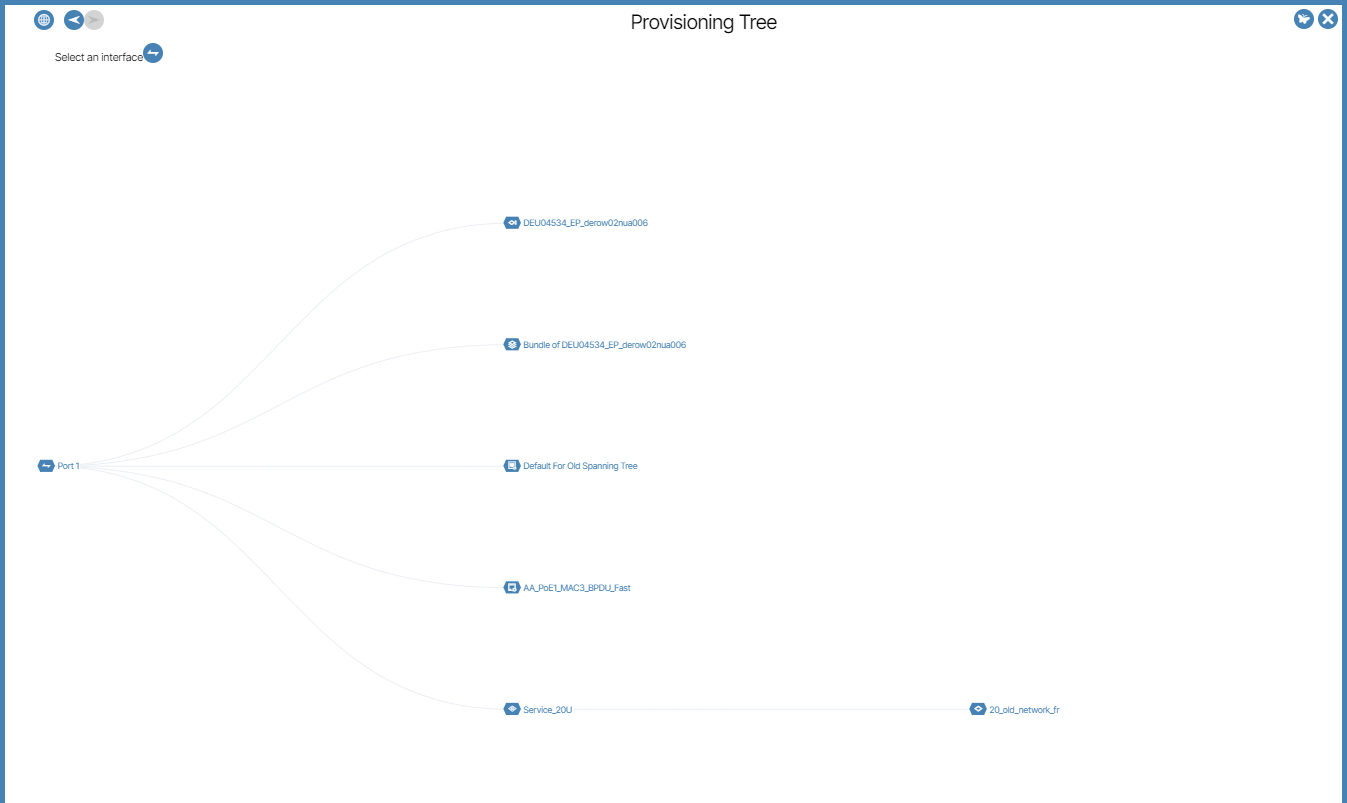
Provisioning Tree🔗
The Provisioning Tree lets you visualize what provisioning objects or interfaces are used for / used by.
There are three ways to access the Provisioning Tree diagram.
- You select Provisioning Tree from the Mini-Map.
- You click the Visualization Button directly on a GUI device port.
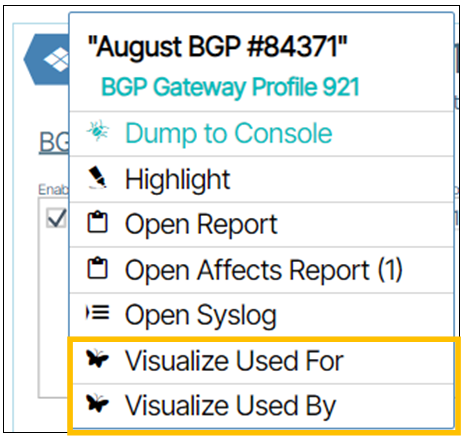
- You select Visualize Used For or Visualize Used By in the provisioning objects Hex button selection menu.
These three choices are described in detail below.
Access Provisioning Tree Visualization from Device Port🔗
Click the ports Open Visualization button (butterfly shaped icon).
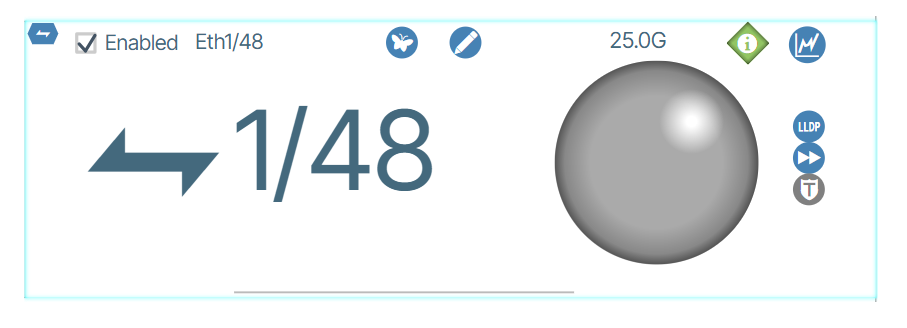
The Access Provisioning diagram opens for the selected port.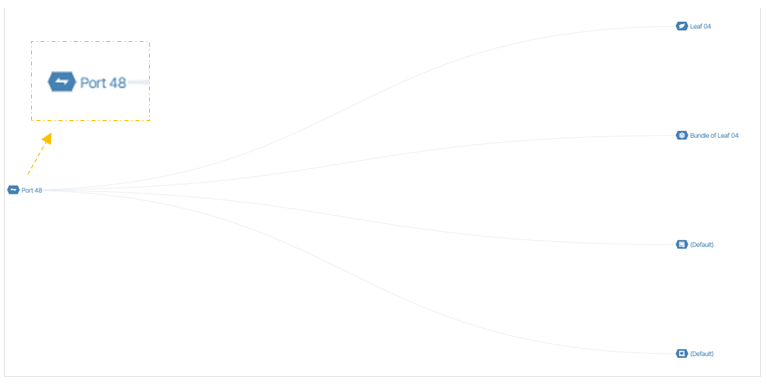
Select Access Provisioning via Visualize Used For or Visualize Used By🔗
When you right-click a provisioning object's Hex button, the menus “Visualize Used For” and “Visualize Used By” are presented to you. These options allow you to view the role of the selected object in relation to other objects.
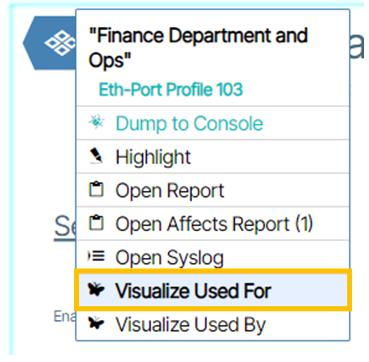
Visualize Used For: This visual representation illustrates the interconnections among objects using the selected provisioning object. The selected provisioning object is on the left, and its hierarchical relationships with the other objects are displayed to the right of it.
In this example Visualize Used For is selected on an Eth-Port-Profile named Finance Department and Ops.
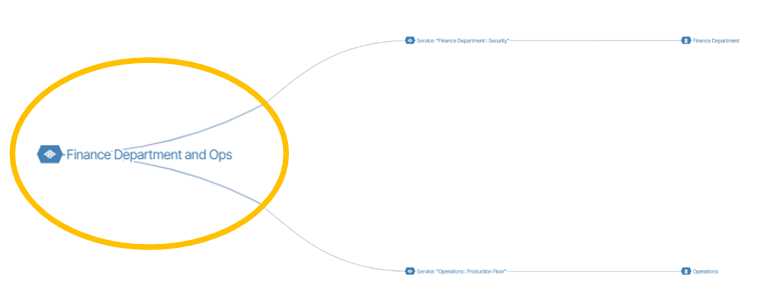
In the diagram below, the object representing the Eth-Port Profile named Finance Department and Ops is rendered to the far left of the diagram and is composed of the objects to the right of it.
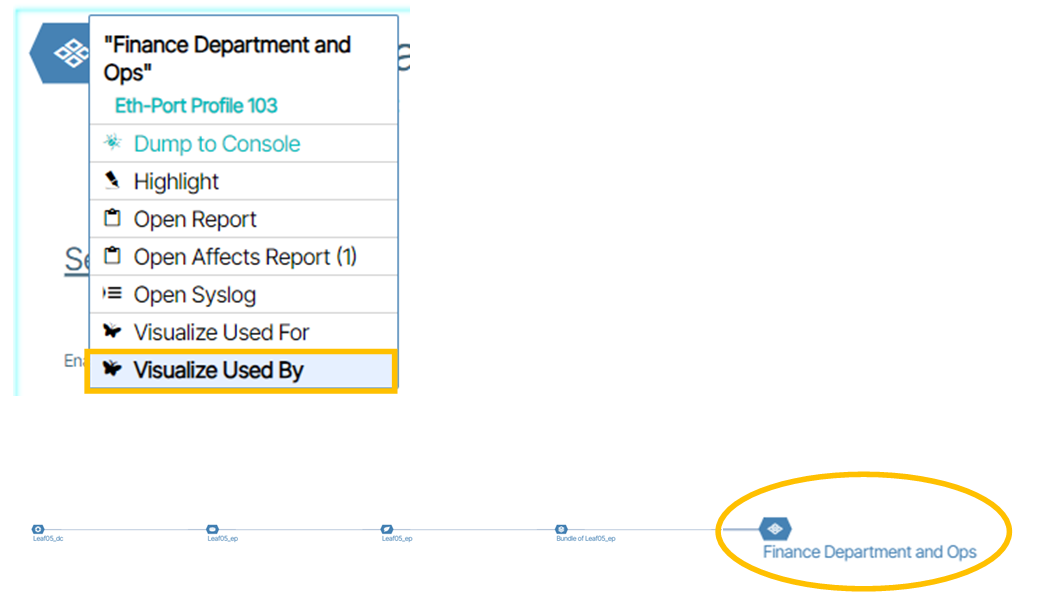
Visualize Used By: This visualization shows objects that are used by the selected object. In this diagram, the selected provisioning object is positioned to the far right, and its hierarchical relationships with objects that use it are presented to the left.
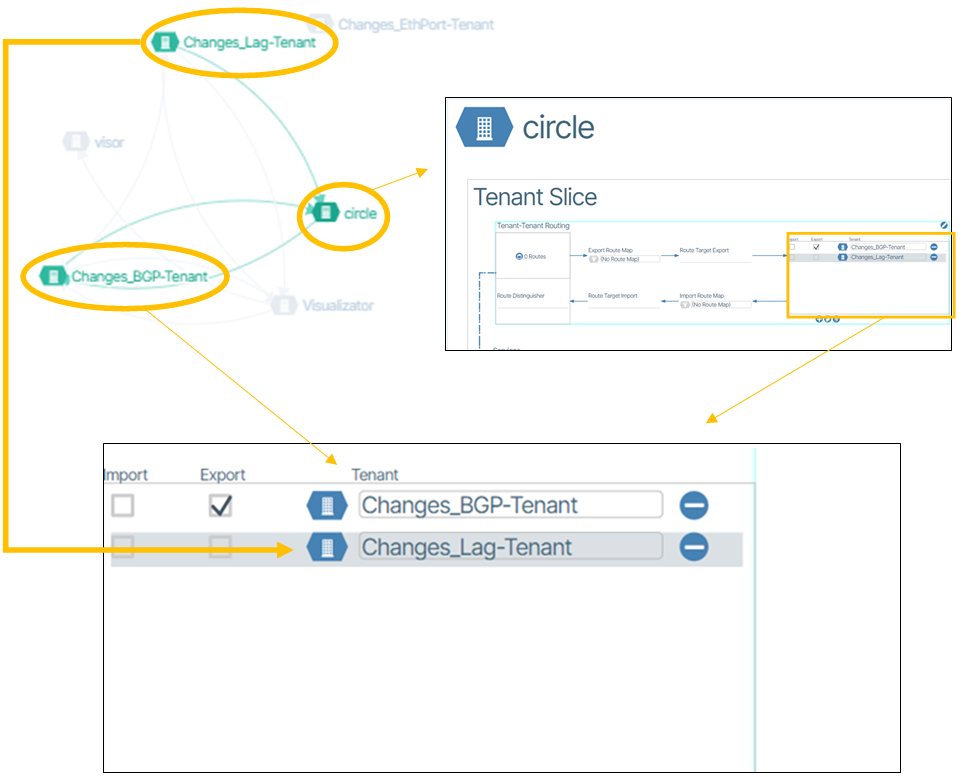
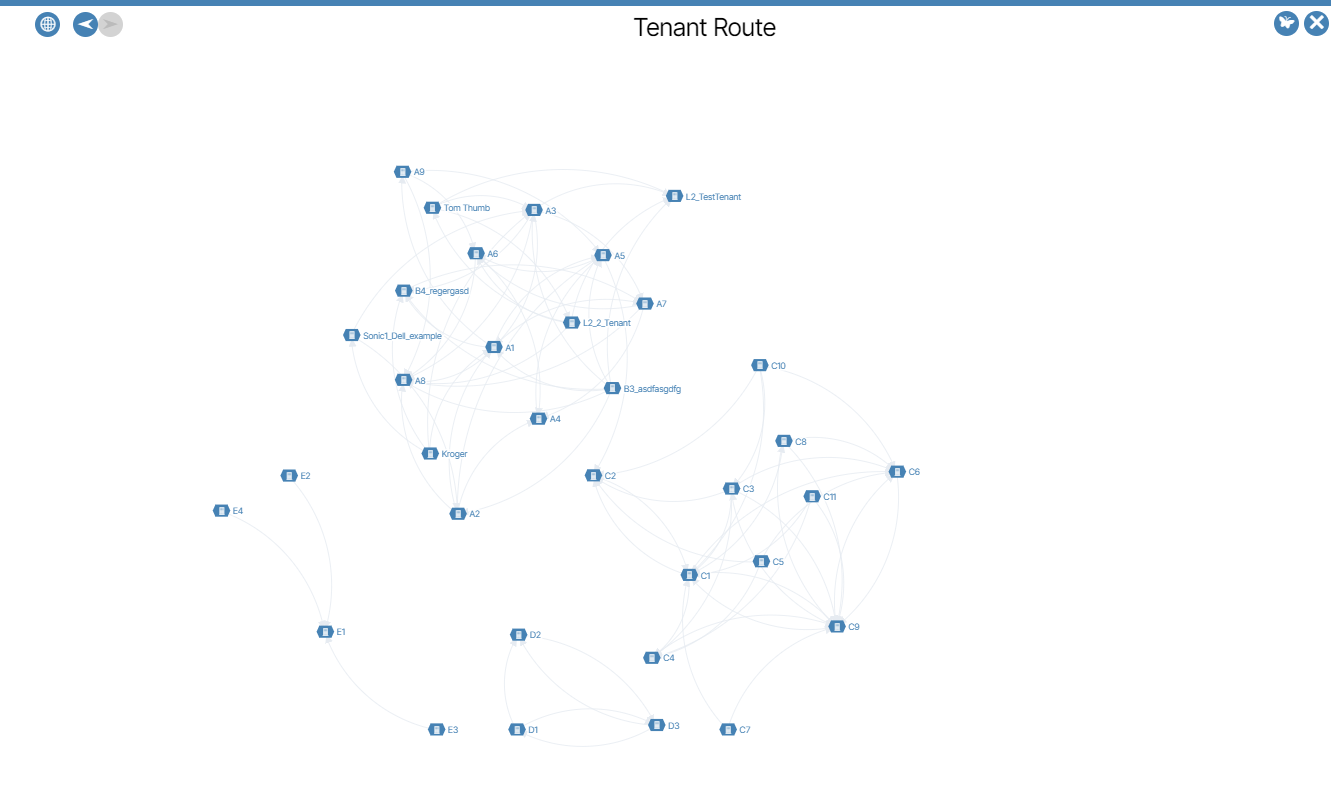
Tenant Route🔗
Tenant Route is a diagram that shows Tenant-Tenant Routing relationships.
Hovering over an individual Tenant highlights its Tenant-to-Tenant routing relationships in green.
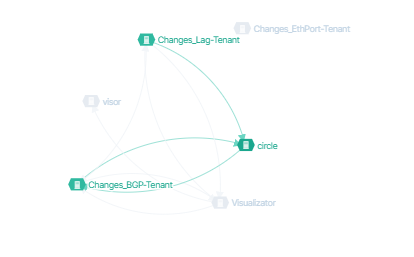
These relationships are reflected in the Tenant Slice window in Tenant-Tenant Routing.