GUI Enterprise
Verity Graphical User Interface for Enterprise Systems
Version 6.2.0


Verity Included Functionality
The Verity software and GUI are instrumental in operational efficiencies for both installation and day-2 operations. Highlights include:
• Automatic network topology detection and service provisioning
• Status indicators with details of network components
• Analytics for traffic performance, optical levels, processor performance, etc. including historical data
• Import of installer spreadsheet specifics of installed endpoint devices necessary to initiate automatic end-to-end provisioning
• Troubleshooting panes that instantly isolate and provide total service path views for rapid fault isolation.
Orchestration and Management
Verity’s orchestration platform, the Virtual Network Controller (vNetC), is typically installed in a datacenter providing cloud control over the managed networks, end-to-end. Key features include:
• Advanced automation reducing deployment times from weeks to minutes
• Network-wide policy deployment increases security
• Detailed analytics and visibility improve performance and speeds troubleshooting
• Template-based provisioning reduces deployment times and reduces errors
Verity Workspace🔗
Verity workspace is the “single pane of glass” in which you set up services, profiles and service bundle templates and apply these objects to the network’s “Service Endpoints”. You can zoom into each section and view more options within each section such as: adding, editing, and deleting elements related to your LAN.

Orchestration Installation🔗
Installing Virtual Network Commander (vNetC) and the Verity Controller (SDLC) are the first steps in creating the Verity network(s). The vNetC contains the database, web server, and northbound interface for the Verity network(s). The SDLC provides the management layer for physical devices in the Verity network. The applications can be installed in a cloud environment and used to manage multiple networks and multiple sites all from a single location. In cases of single site networks, such as an individual installation on a single location enterprise, the vNetC and SDLC can be installed on the same edge x86 platform that is hosting the virtual router, data plane and other NFV applications.
Separate documents provide application installation details.
Verity🔗
Introduction
The Verity system, as it is “software defined”, is managed independently of and agnostic to the underlying hardware. The system operator is focused on bringing services to subscribers and is not focused on the physical components nor the network topology when it comes to provisioning the services. Additionally, templates are used to make the process even more efficient and consistent.
The network topology is auto discovered, and the network connectivity view is automatically created.
User defined object naming is used extensively and is very important for both provisioning and troubleshooting operations, as all names are easily locatable by searching.
The Verity GUI is designed as an interactive workspace with all configurable items displayed in context: showing their relationship to other configuration items and, in most cases, to system operation. The workspace is organized into the following sections:
- System Graphs
- Network View
- Global
- Service Ports
- VNFs
- Services
- Provisioning
- Endpoint Sets
An overview is given for all these sections within this document. A use case of system setup is described for a fresh install of a Whitebox system installed with a co-located edge x86 server. The detailed document regarding Device controllers defines different steps that are required for Blackbox switches. The documentation package provides more detailed documents to highlight other specifics for the various sections.
We show below an example of the GUI main panel for a single site installation, followed by an example of a multisite installation.

Terminology (the follow terms are specific to Verity):
- Service – a layer 2 Ethernet model of VLAN identification, QoS, multicast and other layer 2 related options.
- Endpoints (Managed Endpoints, Service Endpoints) – The “edge” of the network where services connect to client devices. Examples of service endpoints are a room number, street address, office desk location or pole location. Service Endpoints specifically are not a physical network device, but have an “Edge Device”, such as an ONT or Ethernet switch, associated with them.
- Edge Device – a physical unit, such as an ONT or an Ethernet switch, that is fully managed by the Verity system. The ports of the Edge Device deliver the services to the client equipment.
- Top of Rack Switch (TOR) – The layer 2 device that is at the top of the access network topology. It connects to services and routers above, and to the Aggregation Switches and Edge Devices below. In redundant systems there are two TORs, referred to as TOR A and TOR B.
- Aggregation Switch (Agg) – The layer 2 devices that connect the TOR to the Edge Devices. There can be multiple layers of Agg switches. Ports on Agg switches may be used as Service Endpoints as well.
- Switch Endpoint – the database object associated with switch fabric devices (TOR and Agg)
- Service Port – entry point of a layer 2 service into the access network normally through the TOR switch.
- Service Drop – Ethernet port at the edge of the access network that connects to client devices.
- Direct Endpoint – a Service drop directly egressing the network from the fabric switch complex (TOR or AGG) without using an Edge Device. Usually for craft PCs, back-office connections, trunks to unmanaged devices outside the scope of Verity.
- White Box Switch – commercial, off the shelf switch fabric hardware installed with Verity Network Operating System (NOS). The NOS uses standard ONIE installer methods.
- Black Box Switch – any “non-open” switching gear managed by the Verity system. In other words, a TOR, Agg or Edge Device that cannot use Verity NOS. They are usually managed internally by the Verity system using SNMP, CLI or NETCONF.
- ONT – Optical Network Terminal (aka Optical Edge Device) – an Edge Device providing connectivity at the Endpoint that has an optical WAN interface and multiple service drops.
- SDLC – The controller virtual application that hosts containers associated to BlackBox switches.
- Device Controller – A container within the SDLC application used to manage a “black box” switch as a TOR, Agg or Edge Device
- Templating Terms – (the flow of these items is shown on the configuration map)
- MAC Filters – set of parameters related to MAC Addresses and Hexadecimal MASKs
- Ethernet Port Settings – set of parameters related to the physical layer of an ethernet interface (e.g. Speed, full/half duplex, LLDP, PoE etc.)
- Ethernet Port Profiles – combination of Ethernet Port Settings and one or more Services and MAC Filters defining the Layer 1 and layer 2 connection for the service drop. (e.g. High-Speed Internet, Video)
- Authenticated Ethernet Port – list of possible Ethernet Port Profiles to be applied to the service drop based on connect client authentication (e.g. 802.1x, MAC authentication)
- Service Port Profile – collection of services applied to a Service Port
- Voice Port Settings – parameters related to VoIP protocols, interfaces, and related features.
- Device Settings – set of parameters associated to a physical device such as Power-over-Ethernet (PoE) and LED behavior.
- Device Voice Settings – parameters related to the VoIP client installed on an Edge Device.
- Endpoint Bundle – collection of Device Settings, Ethernet Port Profiles, Resident Applications, and Voice Port Settings to be applied to a Managed Edge Device
- Domain – group of sites in multi-site Verity system
- Site – physical site at a location. A site may contain multiple separated layer 2 switch topologies.
- Top of LAN – The switch at the top of a LAN instance within a site with multiple LANs.
Network Topology:
In the Verity system, network topology is auto discovered by the Verity software. Additionally, there is no manual configuration required for interconnects between White Box devices TORs, AGGs and ONTs.
This allows for simple replacement of devices, movement of port connections etc., in the event of hardware component or connection failures. Blackbox devices that support LLDP are also automatically discoverable.
High Level Provisioning Steps:
Details are provided in subsequent sections, but it is first important to understand the high-level flow of how a Verity system is created and configured. The provisioning can be performed before, during or after physical network installation and power up. The user creates Services and the various templates, and then imports a CSV file containing information regarding the Endpoints. Users can create Endpoints manually as well, but the import mechanism allows for a clean process between installation crews and provisioning personnel.
The use case of pre-provisioning and then initializing an Ethernet only white box system is described in the following steps. Black boxes require the extra steps of pre-configuration of the Black Box itself (See specific documents for preparing 3rd party switches) and the creation of associated Device Controllers. These details are covered in a subsequent section.
The GUI contains embedded help via pop-up tool tips so if the parameter is not clear from its name, hover over the parameter’s area to view the tool tip.
- Pre-Provisioning
- Create the Services – give each Service a “meaningful name” and enter information regarding the Layer 2 characteristics.
- Create MAC Filters – give each MAC Filter a “meaningful name” and enter MAC Addresses and Hexadecimal MASKs.
- Create Ethernet Port Settings – the speeds of the Ethernet ports, PoE and LLDP options are completed. A “default” profile is provided by the system and may be used but is not editable.
- Create Ethernet Port Profiles – The Ethernet Port Profile assigns 1 to 25 Services, MAC Filters, and Ethernet Port Settings to an instance of a Service Drop. One of these profiles is created for each type of Service Drop planned for the LAN. Tagging rules are applied here.
- Create Device Settings – Enter device wide PoE and LED information. A “default” profile is provided by the system and may be used.
- Create Endpoint bundles - bundles can support up to 48 ethernet ports. Add the required number of Ethernet ports based on the intended Edge Device hardware and then assign an Ethernet Port Profile to each entry where you expect client devices will be connected. Add a Service to desired Applications and enable them. Assign Voice Port Settings if applicable. Finally, assign a Device profile.
- Create Endpoints – Endpoints can be individually created or managed in bulk by importing a CSV file containing the following columns “Endpoint Name, Device Serial Number, Bundle”. This file can be repeatedly imported, and additions and changes can be handled on the fly. To get the proper file format, create a single endpoint, and then export to a CSV file. Use a text editor or spreadsheet program to add more Endpoints to the file. Once the file is updated, import the file back in.
- Create a Switch Endpoint for the TOR.
- Create Service Ports on the TOR for any trunk connections to non-Verity components (routers, servers etc.)
- Provision Service Ports directly on the Switch Port
- Agg Switch Endpoints can be easily created when the switch hardware is discovered.
- Powerup and discover network switches.
- Connect TOR to x86 LAN connection and power it up. The hardware is automatically associated with the TOR Switch Endpoint.
- Connect AGG switch(es) to TOR and power them up.
- After several minutes, the switches appear in the Network View of the map.
- Create or associate Switch Endpoints for the Agg switches.
- Connect Managed Devices to TOR and AGG(s) switches.
- Connect and power up Edge Devices.
- ONT devices will initialize with configuration and image files installed on the system.
- As devices are discovered, they are associated to their end points and the network is provisioned automatically end-to-end.
Navigation🔗
You can pan or zoom in around the map to view sections in more detail. The GUI is structured to behave like Google Maps. The more the user zooms in, the more context that is shown. A user can scroll in with their mouse wheel or double click to focus on a section. A single mouse click allows the user to “peek” one layer deeper.
There are many ways to navigate through the configuration map:
- Pan
- Hold click and drag on any point of the map
- Use keyboard arrow keys
- Use these techniques to navigate while in edit mode
- Zoom
- Scroll with your middle mouse button
- Use the + and – keys
- Use the keyboard to hold down the Shift key with the up and down keys
- Use these techniques to navigate while in edit mode
- Selecting a section
- Double clicking on a section with the mouse left button zooms in and centers on that section of the screen; this is true even if only part of the section is currently visible
- Hold down the Shift key and click on the workspace again to zoom out by section.
- A quick view map (mini-map) of the sections is show in the top right of the page. Moving the mouse over this section causes it to expand and allow a quick hop back to the zoomed-out view (World View) or to any of the sub sections. Clicking in the empty area of the panes takes you to that specific pane. The mini map also contains a list of links to all reports available in the system
- Icon Referencing
- Clicking on Icons referencing related objects within a given pane moves the user to the referenced object where it can be viewed or edited.
- All icons are described in mouse pop up tool tips which help the user memorize all the options as they become more proficient in using the GUI
- Centering object view
- To center the view of an object while editing, use the keyboard keys Ctrl + Shift + H or the Home button.
Navigation History is available through three different methods. Back and forward icons are shown on the top left of the screen ( ) or can be accessed by holding down the Shift key and pressing the left arrow key. This functions as a “back arrow” and it takes you back to the previous section you were in. To move forward again in the navigation history (after having moved backward in the navigation history), hold the Shift key, and press the right arrow key. The navigation history is also accessible from the main screen icon in the upper left corner (
 ).
).
Do NOT use the browser’s back button, as this will take you away from the system.
The  icon in the top left of the map returns the user to the “world view”.
The mini map in the top right of the world view allows for quick access of the GUI sections, Visualizations and Reports. Mouse over the mini map to expand it.

Workbench Icons🔗
The set of icons on the top left of the world view are called Workbench Icons.
 |
Search ( used for locating names, serial numbers, VLANs, labels, etc.) Jump the current window to a chosen object. System Event Log MAC Address search Navigation History Import/Export Open Overridden Provisioning Growl History (errors from local GUI client) Alerts Network Time Traveler |
|---|---|
Hex Buttons

Hovering over a hex button changes the mouse cursor into the  icon.
icon.
Left-clicking a hex button causes the window view to center on the Hex button container. Right clicking a hex button gives you additional options that apply to the object of that button. Below is an example of right clicking a hex button and selecting the menu titled Endpoint.

Highlighter:
Highlighter  is a powerful tool for tracing an object usage anywhere in the GUI. It is shown within the various objects and at the bottom center of the map. When you use the highlight tool, a purple hue is applied to the selected object. The user cannot use highlighter in the world view, an object must be selected prior to.

Teal filled boxes:
Various default objects show on the map in light teal. These are default or automatically created objects that are not managed by the user. Some examples of default or automatically created objects are in Service Port Profiles, Services, Ethernet Port Settings, Voice Port Settings, Device Settings, Device Voice Settings, etc.
Title Bar – Top Right:

This bar lets you choose the system to view. This bar remains whether you are in the Verity or Admin view.
Bottom Left:
On the bottom left of the screen, there is a navigation depth tracker. You can click on the level you would like to directly navigate back to. An example is shown below.
Reports:
Throughout all the navigation panes, usually on the top right of each sub panel, the GUI displays a report icon  . Clicking on the report icon takes you to a text-based list that can be sorted, highlighted, exported to CSV and navigated from. Also, certain bulk commands are supported from the reports. Those functions are launched by selecting rows in the report and clicking the icons at the top. As always, mousing over the icons lets you know what the functions will do.

Different Report categories are available from the World View in the mini-map. TODO
Filter Slice on Reports
This feature lets you apply a filter to specific report data and to view the data as a pie graph. Filter Slice on Reports is only available to specific report data.
To use the feature, choose a column of report data and click the slice icon.

A pie graph of the chosen data is rendered to the screen.

Expand Referenced Objects:
In some navigation panes, usually located in the top right corner, a GUI icon ( )
)
is displayed to provide details of predecessor objects that are being referenced by a dependent object. The example below shows the object on the left and then the object with expanded references details on the right.

Miscellaneous Icons
All icons have tooltips that are visible when holding your mouse cursor over the icon.
 -Revert to World View
 - Clone is used to create new objects copied from the object you are currently viewing.
 - The system activity log can be viewed in a selective mode by clicking on the icon within an object pane.
 - Edit
 - Save and Cancel
 - Slice – end-to-end view of service delivery
 - Performance graph
 - Delete
 - Hop to connected device
 - Swap switch endpoint and
  link switch from and to switch endpoint
 - Connect to edge device web page (LAN side only)
 - Open a remote access tunnel
 - Debug: dump raw TR-69 parameters of edge device
 - Debug: trigger a full rescan by the ACS of edge device
 - Reboot device
 - Mark device “Out of Service”
 - Apply same settings to multiple ports on a single switch
 - Highlight and show where alerts exist on the map
 - Freeze and unfreeze tile at current obscurity level
 - Searches for MAC Addresses
 - Shows the traffic graphs of an object
 - Shows the traffic of an object
 - Save snapshot of individual device
 - add a preprovisioned switch
 -add and remove badges
 - add/remove LANs within a site
 -save current graph settings
 - Move switch to new site
 - Write notes viewable by other users
 - Select All Reports
 - Toggle a switch to read-only mode
 - drag object used for adjusting network view and moving items in lists
 - Shows state of Redundant Pair
System Admin Icons🔗
System Admin icons are used for internal troubleshooting and debugging.
![]()
The World View – Single Site and Multisite🔗
At the zoomed out, “World” view, the sections of the GUI provide summary information for their respective areas. While zooming in, details emerge.
World View Single Site🔗
🔗

World View Multisite🔗

Application Overview🔗
System Graphs🔗
The System Graphs section displays System wide information such as Service Port activity and virtual machine performance statistics on the GUI. Graph types, subtypes and time ranges can be changed at any time. The user can then save by clicking on the double check mark icon in the top right. The graph selections are saved per user.

In multisite systems, the system graph section is displayed within the network view of each specific site.

Network View🔗
The Network View displays the status and configured connections from the routers/core down to the endpoints and associated edge devices. At the zoomed-out world view, the network view depicts the communication and provisioned status of edge devices and switches as pie charts. Green indicates that that the vNetC is communicating with the edge device and the edge device has been fully provisioned. The network view, at the world view, also indicates how many switches, edge devices, and ports are configured in the network. Alerts are displayed at this level when relevant.

Zooming in on the Network view will reveal the switch interconnections. Clicking on the switch interconnections jumps you to the interconnect on the other end of the connections.

Endpoint Detail🔗
On the Endpoint, the user views the Device Information, Endpoint Bundle’s details, System Section, and can add or remove Badges. The user can edit which Endpoint Bundle the Endpoint uses in this view.

Detailed Endpoint Icons and Managed End Device Icons are shown and described below:

Detailed Endpoint Icons

Endpoint icons (left to right): 1. Slice View 2. System Log 3. Highlighter 4. Edit 5. Delete
Managed End Device Icons

End Device Icons (left to right): 1. Debug: open debug dialog options for this endpoint device 2. Capture snapshot 3. Open a remote access tunnel. 4. Debug: trigger a full rescan by the ACS of this device 5. Reboot device 6. Mark this device “Out of Service.”
Drawing of Video Applications🔗
This feature displays the provisioning of the video application on a device port.

Under Applications there is an option for RF Video. A line connects that box to the RF Video Port.

The RF Video field is static and cannot be edited.
If the MOCA Eth-Port or RF Video is present, there will be an additional line connecting the device.

In pre-provisioned endpoints, you check the boxes shown below to display the Application or the MOCA Eth-Port.

TOR to Aggregation Switch🔗

Aggregation Switch to Endpoints🔗
Note that three stripes in an Aggregation Switch port box indicate that the port is a “point to multi-point” connection (eg. PON).

Endpoint on Aggregation Switch support point-multipoint connections🔗

Site Provisioning🔗
Sections are included at the center bottom of the Network View for various site-wide provisioning.

Site settings🔗
This section includes provisioning management VLAN and spanning tree options.


Spanning Tree Type Wizard🔗
The Spanning Tree Type Wizard is a tool to help you choose the Spanning Tree Protocol (STP) types for each device. To use the Spanning Tree Type Wizard first click an empty space in the Network View tab.
In the window that appears, click the Spanning Tree Type Button

This graph demonstrates which switches support STP (Spanning Tree Protocol). In the final line, the recommendation(s) will be displayed.

LAGs🔗
You can create and edit LAGs in this subsection of Network View. The LAG box is located at the bottom center of the Network view.

Preprovisioned Switches🔗
The Preprovisioned devices let the user set up a switch before the hardware arrives.

Zooming in allows the user to edit the details of the switch.

Manage Rows Button (Set settings to different ports on a switch)🔗
This button provides a convenient way to apply the same settings to multiple ports on a single switch. The settings include switch provisioning as well as the mass enabling/disabling of Edge ports.

Set Eth-Port Provisioning🔗
This option lets you choose an Eth-Port Profile and apply it to a port or to a consecutive list of ports.

Set Eth-Port Setting🔗
This option lets you choose an Eth-Port Setting and apply it to a port or to a consecutive list of ports.

Replace Eth-Port Provisioning🔗
This option lets you choose all ports by their assigned Eth-Port Profile and replace the assignment with a different Eth-Port Profile.

Replace Eth-Port Settings🔗
This option lets you choose all ports by their assigned Eth-Port Setting and replace the assignment with a different Eth-Port Setting.

Clear All🔗
This setting clears Eth-Port Provisioning values and sets Eth-Port Profiles to default for a port or a consecutive list of ports.

Enable Edge Ports🔗
This setting lets you enable an Edge Port or enable a consecutive list of Edge Ports.

Disable Edge Ports🔗
This setting lets you disable an Edge Port or disable a consecutive list of Edge Ports.

The Network view contains tabbed views to show the physical network and the Current Slice.


Current Slice🔗
Slice view is the main troubleshooting pane. It displays the end-to-end view of services being delivered to the ports on the service Endpoint device. It shows the connectivity between all the network components used as well as the relevant provisioning objects to deliver the service. Zooming into the various components gives you more detail about that component. Optical levels are displayed for the optical connections between devices. Essentially, if there is a problem delivering a service to an end user port, the information leading to the disruption is in this single pane. MAC workbench and system logs can be interrogated directly from the slice view focusing on activity relevant to the devices in the slice.

VNFs🔗
This section of the map focuses on the management of the virtual machine installations of the vNetC and SDLC. This includes the ACS, GuiA and DHCP server.

vNet Commander🔗
This section is composed of important processes working within the vNetC virtual machine.
System Applications🔗
System applications are ACS and GuiA. You create a new system application by clicking the add a system application button.

GuiA🔗
GuiA stands for GUI Acceleration and is a new system application that increases UI performance. To add GuiA to your application, follow these steps.
-
Open the Admin tab and click Settings.

-
In Feature Flags check the box next to Enable GuiA and save your selection. You are only allowed 1 GuiA instance for your application.

- Go to Verity

- Click VNFs

- In the window that appears, click to open the SDLC contents.

- In the window that appears click the plus icon.

- Choose GuiA from the prompt that appears.
- In the window that appears enable the application and fill out the fields with the relevant IP information.

- Save your work by clicking the checkbox icon(
 ).
). - The yellow Status box text reads Awaiting Status. When it changes to Connected, the process is complete.

Device Controllers🔗
Device Controllers on the Aggregation Switch are added and edited in this subsection. Device Controllers can be imported or exported from a file.

The Device Controllers object is used to create the interface between the Verity application and the 3rd party “black-box”. The black-box can be configured as a “Top of Rack” Switch, Aggregation Switch, Active SFP, Split-Edge Device or an Edge Device. Based on the LLDP capabilities of the black box, it can be automatically discovered in the network topology, or it can be statically located.

A Service is used to connect to the black box’s in-band management interface. IP addresses are defined for the Device Controller and the black box to establish the communications link. Finally, management protocol options for communications to the black box are entered. Once discovered on the network, the provisioning of services in the black box is seamlessly handled by the Verity software.
For systems containing large amounts of black box switches, the configuration of the Device Controllers can be imported/exported from the Import/Export tool bench. This is also very useful for the use case of brownfield transition.
An example file format of importable Device Controllers is shown below.

Global🔗
The Global block contains subsections for Licensing, Badges, and Radius Servers. This menu is used to change non-network affecting settings. Badges are for labeling devices into groups, Licensing displays license usage and Physical Port usage, Radius Servers allow you to set how users log into the application.

Licensing🔗

The Licensing object displays License Usage and Physical Port Usage bar graphs. While focused on the object, the user can see the date of licensing expiration, contact information for support, and reports of license.
By clicking on the report icons for License Utilization, License by Device Utilization, and Physical Port Utilization, a report for those lists will be shown. For a specific report on used, preprovisioned, stranded, or spare licenses, the user can click on each section of the bar graph. This can also be done with physical ports that are licensed, fabric or spare.
An example License Utilization report is shown below:

Badges🔗


The Badges object allows the user to manually create badges to assign to endpoints. Each badge is assigned a color and number that will appear next to endpoints in Endpoint Sets or Views. Badges can be used to define rules in Endpoint Sets or Views.
Radius Servers🔗
Remote Authentication Dial-In User Service (RADIUS) is a networking protocol that provides centralized Authentication, Authorization, and Accounting (AAA or Triple A) management for users who connect and use a network service. RADIUS is a client/server protocol that runs in the application layer and can use either TCP or UDP as transport. The devices associated with Endpoints control access to a network as they contain a RADIUS client component that communicates with the RADIUS server. RADIUS is often the back end of choice for 802.1X authentication as well.

The radius servers are listed here with their IP addresses and credentials. The Radius server and the ONT communicate to allow one of the Ethernet Service Profiles within an Authenticated Ethernet Profile objects to get applied to the ONTs port.
SFP Breakouts🔗
This feature allows you to define how an SFP behaves based on the vendor and part number. The GUI provides two ways to recognize user defined SFP behavior, globally or by overriding port settings. To use this feature it must first be enabled. To do so, click the Admin tab and then click the Settings tile. Under Settings enable the Feature Flag titled SFP Breakouts.

Globally🔗
If your intent is to set SFP device behaviors globally, throughout your system, you set this information in the Global / SFP Breakouts list. Here, you list devices by vendor and part number, and you set the behavior for each device under the field labeled breakout.

Port Specific Override🔗
If your intent is to set an SFP device behavior on a specific port and override existing behavior, you can do so with the SFP Breakout Override form. Setting SFP devices in this way overrides existing behaviors set in the Global Breakout settings.

Services🔗

Services are shown in a summary list of the top used services in the zoomed-out view and when zoomed in, show the individual service objects for provisioning. The summary view can be toggled to show bar graphs as well.

The following figure shows the details within a service dialog box used to edit the parameters of the service. The numbers on the right under the Service’s name provide the user with a quick cross reference regarding the usage of this service related to service ports, bundles, and service endpoints.

The fields in the Service box are self-explanatory with pop up tool tips when stopping your cursor over the field name or value.
Services Allow Fast Leave (IPTV immediate leave)🔗
Allow Fast Leave is a feature in Services that provides an “immediate leave” option when Multicast Treatment is set to one of the IPTV types. The Allow Fast Leave feature causes the switch to immediately remove a port from the forwarding list for an IGMP multicast group when the port receives a leave message. Allow Fast Leave is recommended for use unless there is only a single receiver present on every port in the VLAN.

Groups🔗
Provisioning Objects can be organized into collections called Groups. Groups do not affect the behavior of Provisioning Objects and are used only for aesthetic and organizational purposes.
How to Create Groups🔗
Open the tile of an object that you want to include in a group. In the example below, a Service tile is used.
The upper right corner of the window contains a field named Group.

Double-click the field to edit it. Click Create New Group.

Click the checkmark button.
![]()
A window appears prompting you to name your Group.

Type and submit a name by clicking the checkbox button. The Service is automatically placed in the Group. Any Groups you create are available in the Group drop down menu. As an example, the following image contains 2 custom Groups, one named Accounting East and the other named Accounting West.

The parent tile window renders a new tile for each Group.

Creating Groups from Reports🔗
Groups can be created via the Reports window. To do this you need to first navigate to the Reports window of the object(s) you want to group.

Here, Actions are used to create Groups. To create a Group using Actions, click Actions, click Set Group, name the Group, click Accept Changes.

The changes are made and visible in the Group column.

Provisioning🔗
These panes have three zoom levels. The first level shows the count of template objects with a diagram depicting their relationships. Note that the line coming from the left arrives from the services.
Any objects that are changed once they are in use are automatically updated everywhere they are referenced. For example, if an object is renamed, all references to it are also automatically renamed. Additionally, if a single parameter is modified, all objects inheriting that parameter are also updated. This is a powerful feature, and the user is given a pop up indicating the count of objects affected throughout the system.
All provisioning profiles contain a non-editable instance named “Default” shown with a green background.

The second zoom level lists the top used objects for that section, with the count of affected endpoints.

Further detail is provided for the Eth-Ports section as shown below:

Packet Queuing🔗
This feature lets you use an existing Packet Queue or create a new one using the  icon.
icon.

The window that appears lets you make your changes. Here you set the priority for p-bits and set the bandwidth (BW) for each queue as a percentage. The percentage is the maximum average percentage of the port output bandwidth that packets in that queue will be allowed to consume. The value cannot exceed 100 and a value of 0 means no limit is set.

MAC Filters🔗
MAC Filters consists of MAC Addresses and Hexadecimal Masks. When a MAC Filter is assigned to an Eth Port Profile, the Services assigned to that Eth Port Profile can be translated to the same VLAN.

Ethernet Port Settings🔗
The following figure shows the detail within an Ethernet Port Settings dialog box:

This window is used to set Ethernet Port speeds, per Port PoE settings and client device LLDP handling.
Unidirectional Link Detection (UDLD)🔗
Unidirectional Link Detection (UDLD) is a Cisco-developed layer 2 protocol that is used to determine the physical condition of a link. Its purpose is to identify and address any problems that may be caused by Unidirectional Links.
Unidirectional Link Detection is available in Eth-Port Settings under Loop Protection.

Eth-Ports🔗
![]()
Eth-Port Profiles🔗

Ethernet-Profiles provides the definitions for each use case of Ethernet port usage within the network. It is a packaging of up to 25 services that are served by this port type combined with the Ethernet Port Settings and MAC Filters. Examples of external VLAN handling are shown in the example above.
Enabling the “Monitored Port” option allows the service status of ports using this profile to be included in system alert reports.
Authenticated Eth Ports🔗
An Authenticated Ethernet Port profile is comprised of a list of Ethernet Port Profiles. This feature is used on networks that employ user detection and authentication via 801.1x protocols. The Managed End Device communicates to connected user devices as they connect to the assigned port, and relay control messages to a Radius server, to validate the user and select and enable the appropriate Ethernet Port Profile on the port.
An example is shown below.

The “Settings” section allows a change in the connection mode the user device contains, ranging from 3 different modes. Port Mode, which is the standard mode, Single Client Mode which disables traffic from a second client, only allowing the authenticated client’s traffic to pass. Lastly, Multiple Client Mode which allows multiple clients’ traffic to pass.
Service Port Profiles🔗

Service Port Profiles are normally assigned to links or LAGs connected to the TOR switch of the network. The user can edit the maximum downstream rate allowed on a per service basis. Other parameters such as spanning tree and port monitoring are set on the physical link.

NBI Eth Ports🔗

NBI Port Access Control is a configurable GUI feature that administrators apply to selected ports. It grants a client of the API access to the specified ports, enabling it to retrieve MAC addresses connected to those ports and control the set of services allowed on said port(s). The API utilizes a Representational State Transfer (REST) style interface over HTTPS.
The current port state is accessible to any user via the API. Only users with read-write and admin-level privileges can modify a port's configuration.
Voice-Port Settings🔗
An example of the Voice Profile is shown below. It covers various voice settings and features that are port specific.

Device Settings🔗

LED Control time is a parameter that defines the number of seconds the LEDs will illuminate after a state change before extinguishing. This is used, for example, in hospitality installations to prevent blinking lights from disturbing a hotel client. The value of “0” disables the feature and allows the LEDs to operate normally.
Power over Ethernet settings are used to set capacities of specific hardware devices that provide this feature.
Mode:
Automatic – The endpoint hardware or ONT handles all PoE automatically. No provisioning from the orchestration platform with regards to PoE will be used. This works for most cases.
Manual – Power allocation and port priority are provisioned by Verity. This is for more complex PoE scenarios.
External Battery Power Available: When the ONT is connected to an external battery backup, this is the maximum amount of power that the ONT should use to power PoE devices. This can be used to force low priority ports off when power is lost to preserve battery for higher priority ports.
External Power Available: Enter the power capability of the power supply powering the ONT.
Usage Threshold: Percent for comparing the currently consumed power to the allocated power. If the percentage of consumed power over allocated power is over the usage threshold, a fault condition is reported and logged.
🔗
Provisioning Security🔗
This functionality encompasses security audit interval configurations that are individually applied to each switch.
Security Audit Interval🔗
The frequency, measured in minutes, at which the Switch running configuration is reread and compared to expected values. If left blank, the audit will never be executed.
Commit to Flash Interval🔗
The frequency, measured in minutes, at which the Switch configuration is saved to flash. If the value is empty, the system will never commit to flash.
Device Voice Settings🔗
Parameters that are generic to each device (where all ports on a device must share) are shown in the following example. There are two formats for the dialogue box based on whether SIP or MGCP is used.

Endpoint Bundles🔗
The following figure shows the detail within a Bundle dialog box used to combine the device settings, Ethernet Port Profiles/Dynamic Policies, and Residential Applications. The number of Ethernet lines represented can be adjusted with the “+” and “-” icons, when not in edit mode. There are also buttons for removing, adding, and swapping multiple Eth-Ports.

To get the most effective use of bundles, it is highly recommended to have a deliberate plan for network installation that allows for consistent port usage across the network. The more devices that can be managed with fewer bundles, makes provisioning and operations of the network much more efficient.
Endpoint Sets🔗
The Endpoint Sets section covers Endpoint Sets, Endpoint Views, and Preprovisioned Endpoints.

Endpoint Sets are one of the most powerful tools within the Verity GUI as it addresses dealing with multiple objects simultaneously. For ease of management, Endpoint Sets are organized by user-specified rules and allow the user to define the desired Software Versions for each set as well as provide status summaries for each set.
The zoomed-out Endpoint Set section view displays a summary of the current sets.

Endpoint Sets are exclusive, meaning that every endpoint in the GUI appears only in one set. Starting from the top, unassigned devices are placed in the first set. Following the Unassigned Devices, the user can create multiple sets with rules based on badges, badge color, endpoint, endpoint bundle, or serial number. Endpoints that fit the criteria are sorted into the following sets. Any endpoints that do not meet the requirements of the user-made sets will be added in the last set, All Others. By double-clicking on each Endpoint Set’s Members box, the user can see and take actions regarding the endpoints in that set.


The Target Software Version of the endpoints can be individually edited in View, or the user can use the upgrader feature to upgrade the Target Software Version of all the endpoints in that set. Endpoints follow the Software Version assigned to the entire set but can be individually upgraded.
Endpoints can be imported from an installation worksheet (CSV file) that contain information lists about the Endpoint name, the expected physical device installed at the Endpoint, and the Bundle to be assigned to the device. This function is part of the Import/Export work bench tool.
Endpoints can be pre-provisioned or created after the network has been powered up. They can be created one at a time or imported from the CSV file.
As the installers are working on the physical installation, they keep track of their work by creating a text file that describes the Endpoint Name, the serial number of the device installed in the endpoint and the endpoint bundle to be applied (based on what was “wired” into the ports). This file can then be imported into the system either before or after power is turned up. (In order to get the proper format, it is good practice to manually create one endpoint, using the “+” icon, and then export the one row file to show the column headers and ordering).
This file can be re-imported on top of itself as the file is changed, and the user will be informed of “adds/changes/deletes” because of the import.
Endpoint Views🔗

Endpoint Views are organized by name, device, bundle, upgrader status, target software version, badges, type, communication status, or provisioning status. They are like sets; however, they are not mutually exclusive, meaning Endpoints may be shown in multiple views.
Preprovisioned Endpoints🔗
Preprovisioned Endpoints are akin to other groupings, targeting Endpoints whose corresponding devices have not yet been identified.

Network Troubleshooting
The Verity GUI is designed for efficient operational support of the Verity environment. Real-time analytics, tracing and search capabilities are specifically designed to deal with network and device troubleshooting. There are a series of work benches provided to the operator to enhance and accelerate the task of troubleshooting.
Workbench🔗
Workbench Bar🔗

Search Workbench🔗
The typical use case for troubleshooting is when an end user calls in a complaint about a malfunctioning service. In this case, the first action by the support personnel is to find the equipment related to providing the service and diagnosing element by element. At this point, the Verity GUI user enters the information received from the customer in the search box, and a list of related resources represented as hex icons is presented. From that list, the GUI user clicks the icon to jump to the selected resource or they can right-click to select from a drop-down menu of troubleshooting options.

VLANs can be searched by number.
Jump Workbench🔗
To quickly jump to an area in the GUI, the user can use the Jump workbench and click on the listed sections: Hardware, Provisioning, and Endpoint Collections. By clicking the arrows, the user can access different sections of the GUI by clicking on the options in the dropdown.

System Event Log🔗
The System Event Log provides detailed information regarding all actions (user induced, equipment induced, etc.) affecting the network. Generally, when failures occur in a network, either a physical component has failed, or a user has logged in and changed provisioning. The log can be filtered on various criteria and gives the user all the details needed to view the recent history of the network.

MAC Address Workbench🔗
The MAC address Workbench is a powerful tool that provides information regarding connected devices. Wild card entries, direction and Service name are some of the filtering options.


Navigation History🔗
The navigation history provides the user quick hops to the locations on the orchestration map that the user has recently viewed.

Import/Export🔗
The Import/Export Workbench allows the user to import or restore all provisioning back to the system. The user can also export or save all provisioning of the system to a text file. And the user can compare provisioning or view the differences between current provisioning and a text file to import.

Overridden Provisioning🔗
This workbench allows you to see all the provisioning changes you have made and confirm or revert them without being on a specific object.

Growl History🔗
Growls are usually fatal errors that occur between the client browser and the Verity orchestration platform. Holding the mouse over the growl gives the user more detail about the error. Other information may be conveyed by the growl, but most information about the network is retrieved from the System log mentioned above.

Alerts🔗
Alerts are active system anomalies regarding provisioning, device issues and “Monitored Port” exceptions.

Network Time Traveler🔗
Network Time Traveler is a tool to create and restore system backups.

General🔗
Packet Capture🔗
This feature lets you capture network packet information and save the data to a file.
To start a packet capture, click the ( ) of an interface.
![]()
The Packet Capture window appears. Enter the parameters for the data you want to capture and click Start.

When data capturing is complete, a pcap file containing the information will be downloaded to your computer.
Color Legend🔗
The Verity map conveys system and device status via a variety of colors to enhance the operator’s understanding of the current network status at a quick glance. Tooltips allow the user to see the definition of the colors on the map. Some examples are shown below.
Devices/Switches
White - Normal
Dark Gray - Out of Service (manual or fault)
Pink - Unprovisioned (hardware detected on the topology, but not associated to a Switch Endpoint or and Endpoint
Green - Provisioning or database synchronization in progress
Red => Failed Provisioning
Comm LEDs (Ovals)
Green - In Communication
Red - Loss of Communication (> 5 Minutes) or impaired by upstream associated device or link failure
Link Lights (Circles)
Green - Link Up
Red - Link Down on provisioned switching network port
Gray – Link Down on idle port or end user port
Visualization🔗
The Visualization feature displays graphical representations of various device details.
To use the Visualization feature, open the mini map from the world view and select an option under “Visualization”.

In addition to launching the Visualization feature from the mini-map, you can also open it by clicking the “Open Visualization” button, identified by a butterfly icon.

Diagrams🔗
The following sections describe the data representation of each diagram.
Site Read Only Progress🔗
For each site in a multi-site system, this diagram expresses the contrast between switches that are read-only and provisioning. It allows you to assess the provisioning progress of a site.
Site read only (multisite only): describes read only (brown) to provisioning (light blue) progress per site.
- x-axis: Number of switches
- y-axis: List of sites

Site Switch Density🔗
For each site in a multi-site system, this diagram expresses the contrast between the number of switches between sites.
Site switch density (multisite only): Darker colors represent higher density, and lighter colors represent lower density.
- x-axis: Number of switches
- y-axis: List of sites

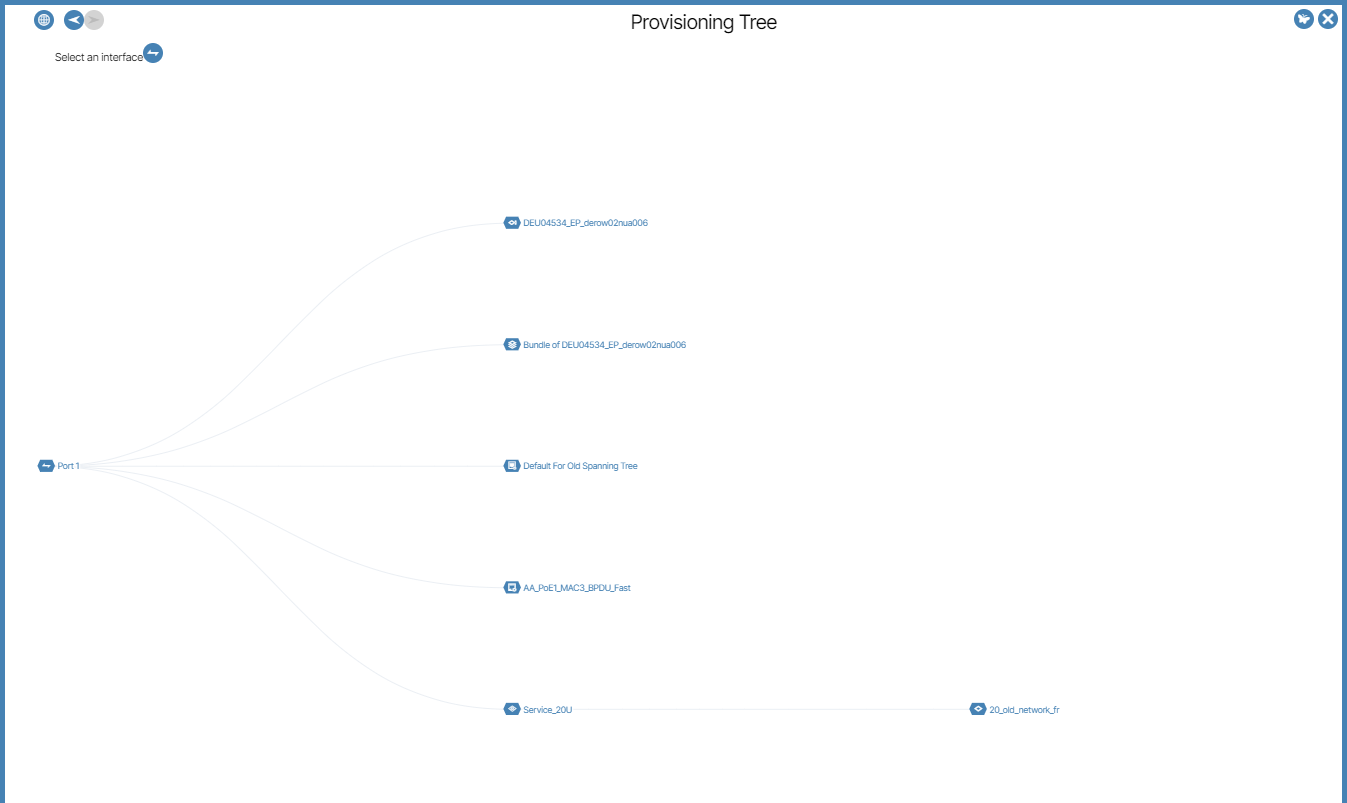
Provisioning Tree🔗
The Provisioning Tree lets you visualize what provisioning objects or interfaces are used for / used by.
There are three ways to access the Provisioning Tree diagram.
- You select Provisioning Tree from the Mini-Map.
- You click the Visualization Button directly on a GUI device port.
- You select Visualized Used For or Visualized Used By in the provisioning objects Hex button selection menu.
These three choices are described in detail below.
Select Provisioning Tree from Mini-Map🔗
Opening the Provisioning Tree Visualization from the Mini-Map renders this information:

Clicking the Select an interface button opens a form where you select the Port that you want the visualization to reference. To do so, you need to select the Site, Switch and Port options.

For single site instances, the Site option is removed.

Access Provisioning Tree Visualization from Device Port🔗
Click the ports Open Visualization button (butterfly shaped icon).
![]()
The Access Provisioning diagram opens for the selected port.

Select Access Provisioning via Visualized Used For or Visualized Used By🔗
When you right-click a provisioning object's Hex button, the menus “Visualize Used For” and “Visualize Used By” are presented to you. These options allow you to view the role of the selected object in relation to other objects.

Visualize Used For: This visual representation illustrates the interconnections among objects using the selected provisioning object. The selected provisioning object is on the left, and its hierarchical relationships with the other objects are displayed to the right of it.
In this example, Visualize Used For is selected on an Eth-Port-Profile named Finance Department and Ops.

In the diagram below, the object representing the Eth-Port Profile named Finance Department and Ops is rendered to the far left of the diagram and is composed of the objects to the right of it.

Visualized Used By: This visualization shows objects that are used by the selected object. In this diagram, the selected provisioning object is positioned to the far right, and its hierarchical relationships with objects that use it are presented to the left.


Admin🔗
Admin is the user control panel for the VNetC.


Provisioning Reserved Ranges🔗
Provisioning Reserved Ranges is where you configure provisioning reserved ranges.
Routing🔗
Routing includes the following WAN information.
- Certificate Hostname
- RAT Port Range
- WAN IP Source (DHCP or Static)
- WAN Default Route
- WAN IP Address
- DNS Server
Software Packages and Licensing🔗
System software updates are available in Software Packages and Licensing.
Certificate Management🔗
Certificate Management is a drag and drop control panel to use SSL Certificates
Branding🔗
Branding is where you apply custom business branding to your application.
Settings🔗
Settings lets you enable different application feature flags as well as configure the following settings.
- vNetC Address on Management VLAN
- Permissible IP Address Ranges on Managed Devices
Monitoring, Backups and Logging🔗
Monitoring, Backups and Logging lets you configure status monitoring, backups, and loggings of the vNetC via SNMP, SFTP and SYSLOG.
Report🔗
Report lets you run scheduled service reports and export the data as a CSV file.
Users and Permissions🔗
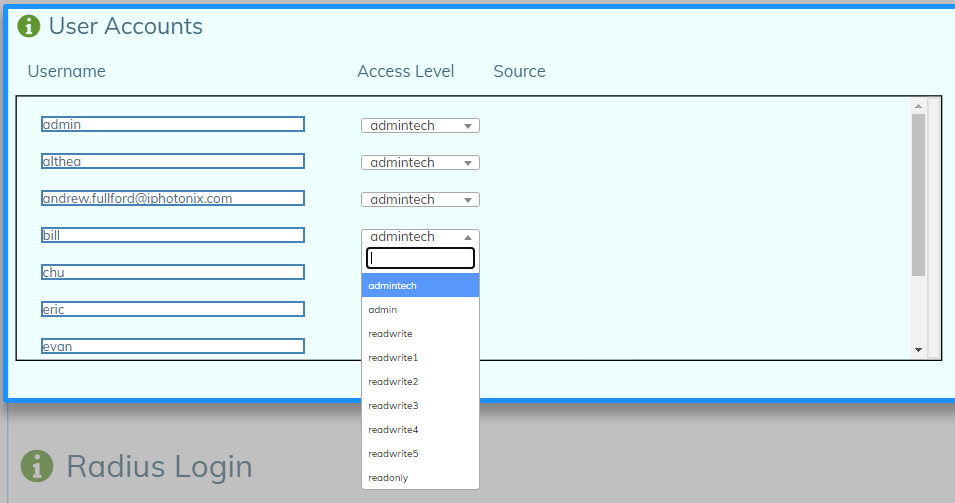
Accounts🔗
Users and their privilege level are listed in Accounts. This is where you manage User accounts, access levels and passwords.
Radius Login🔗
Radius login is available under Admin/User Accounts. VNetC web login authentication authorization via RADIUS.
User Permissions🔗
User Permissions lets you set permission levels to roles.
Limits🔗
Limits is where you set the maximum number of Users per role.
Site Permissions🔗
Site Permissions is where you manage site permissions for each user role that has permissions enabled. Site Permissions are not applicable to admintech or admin user roles.
SSH Access🔗
SSH Access is where you manage SSH access and SSH keys.
How to Set User Role Permissions🔗
To change user permissions, you first enable the user permissions feature flag.
Select the Admin menu tab.
Select the Settings item box.

Enable the checkbox titled Granular Permissions.

Refresh the page and click the Admin menu tab.
Double-click the Users and Permissions tile.

Double click the User Permissions box. This box will not be visible if the Granular Permissions checkbox in step 3 remains unchecked.

The window that appears lets you enable and disable permissions for different user roles. The role titles are listed at the top of the window.

Assigning Users to Roles🔗
As user role permissions are created, you set users to those roles. If you choose to set permissions after user role assignment, all permission settings will affect the assigned users of that role.
Select the Admin menu tab.
Double-click the Users and Permissions window tile.

Select the Accounts window tile.

Click the edit icon ( ) in the upper right corner of the Accounts window to edit the page.
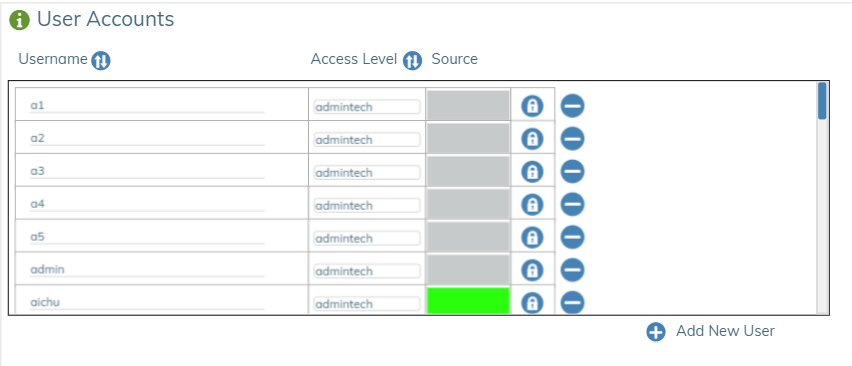
Choose the Username you want to change and set the Access Level to the desired role.
- To complete the process, click Save button (
 ) in the upper right corner of the User Accounts window to save your work.